SNAA390 july 2023 LMK6C , LMK6D , LMK6H , LMK6P
- 1
- Abstract
- Trademarks
- 1Introduction
- 2Test Standards and Test Setup
- 3Sinusoidal Vibration, Random Vibration, and Mechanical Shock Tests
- 4Comparison of BAW Oscillator Vibration Performance With Crystal Oscillator
- 5Summary
- 6References
3.1.2 Results From Sinusoidal Vibration Test
Sinusoidal test is conducted at a fixed sinusoidal vibration frequency of 50, 100, 200, 500, 1000, and 2000 Hz with 10 g acceleration for all three axes. Phase noise plots from these tests are captured. The following plots are for the Z-axis for DLF-4 package. A spur sticking out at the frequency of vibration can be observed in each graph. Based on the test results and captured data, the vibration sensitivity in terms of ppb/g is calculated for BAW oscillators.
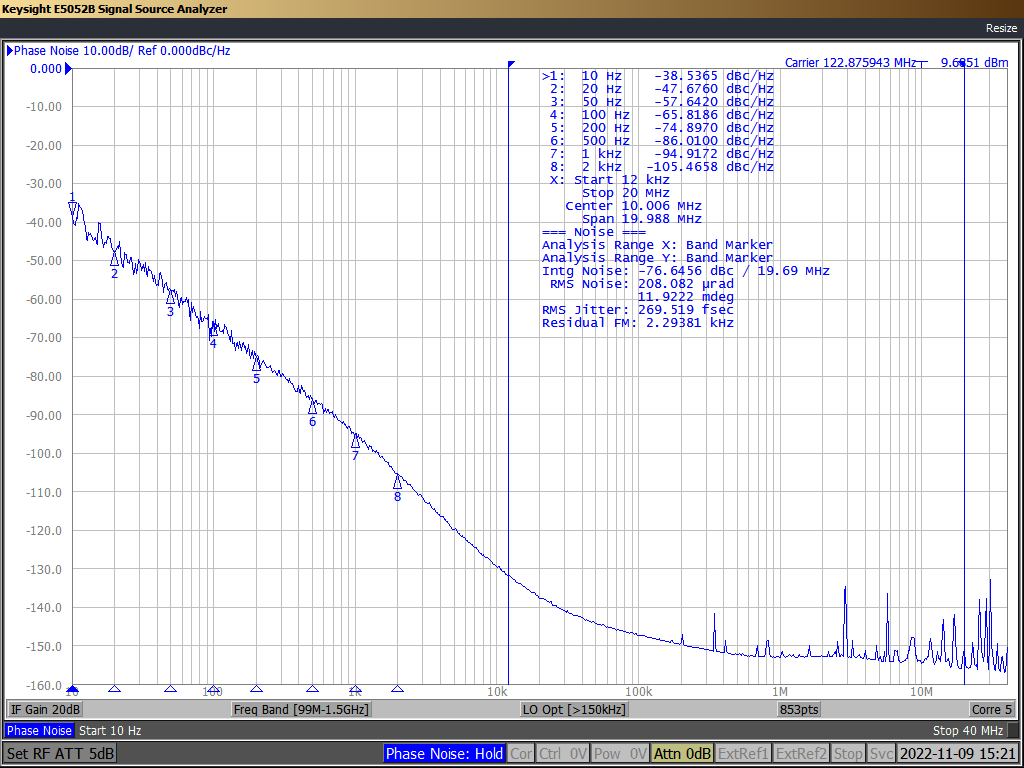 Figure 3-1 Baseline Capture Before
Sinusoidal Vibration
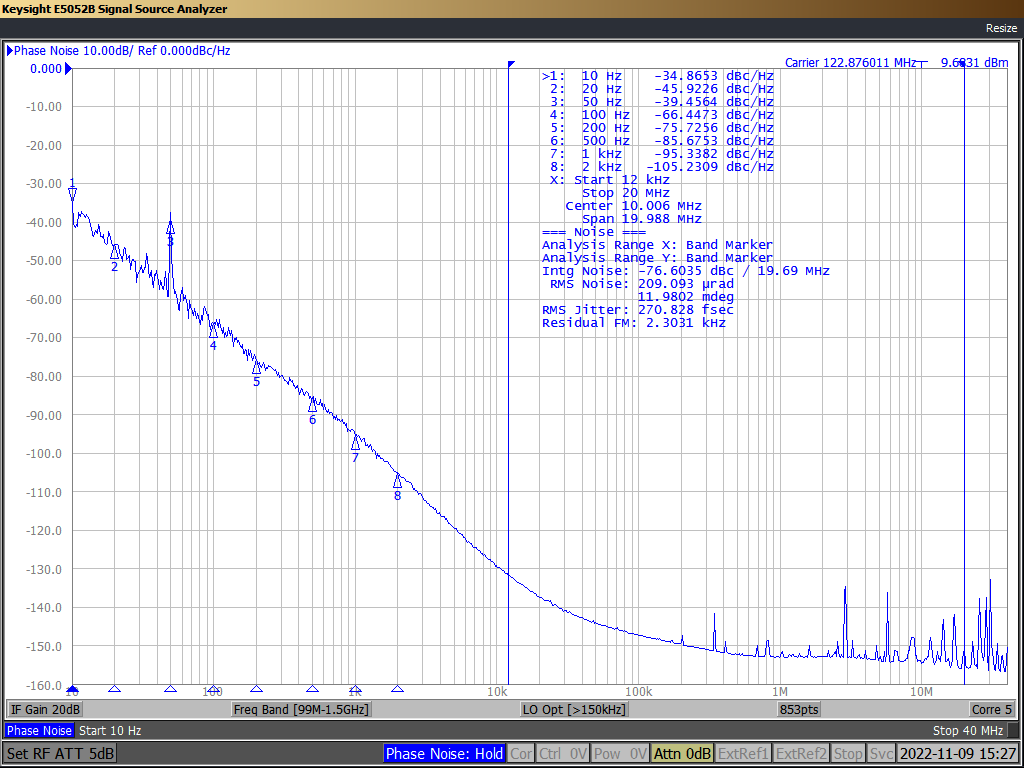 Figure 3-2 Capture of Sinusoidal
Vibration at 50 Hz
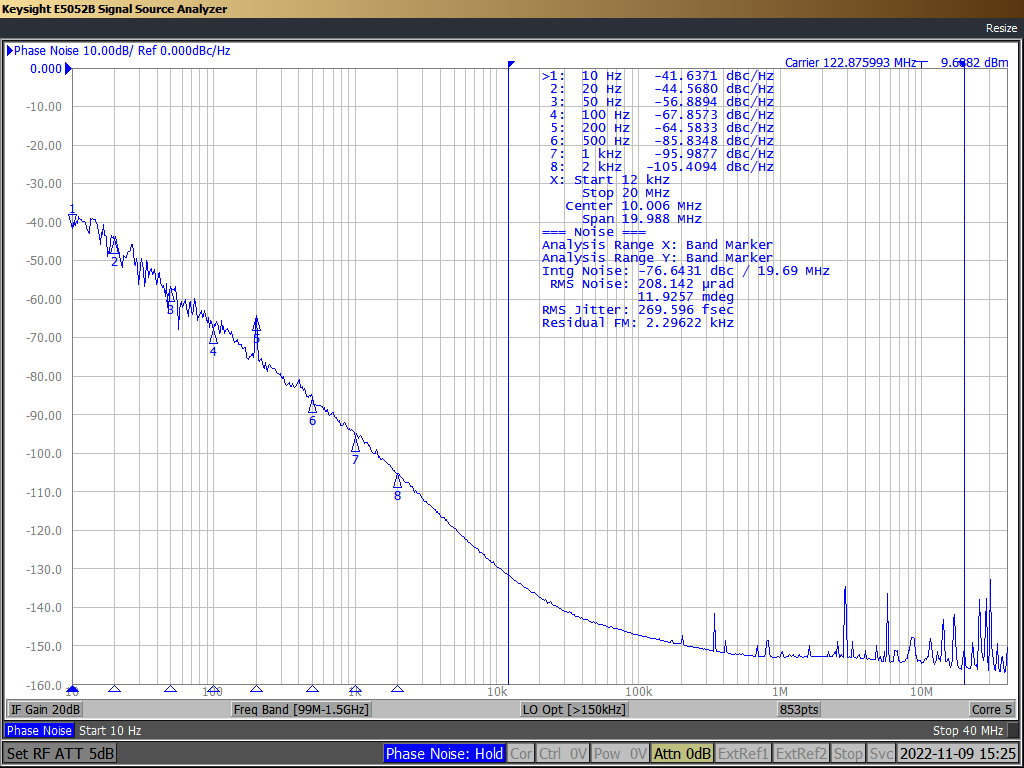 Figure 3-4 Capture of Sinusoidal
Vibration at 200 Hz
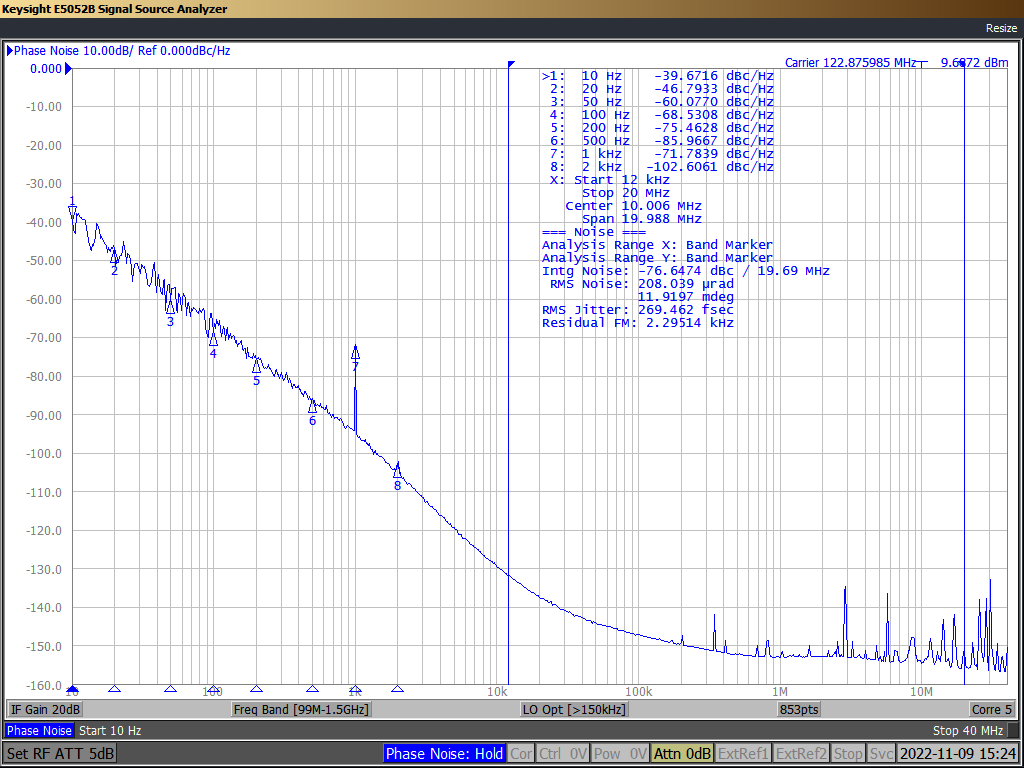 Figure 3-6 Capture of Sinusoidal
Vibration at 1000 Hz
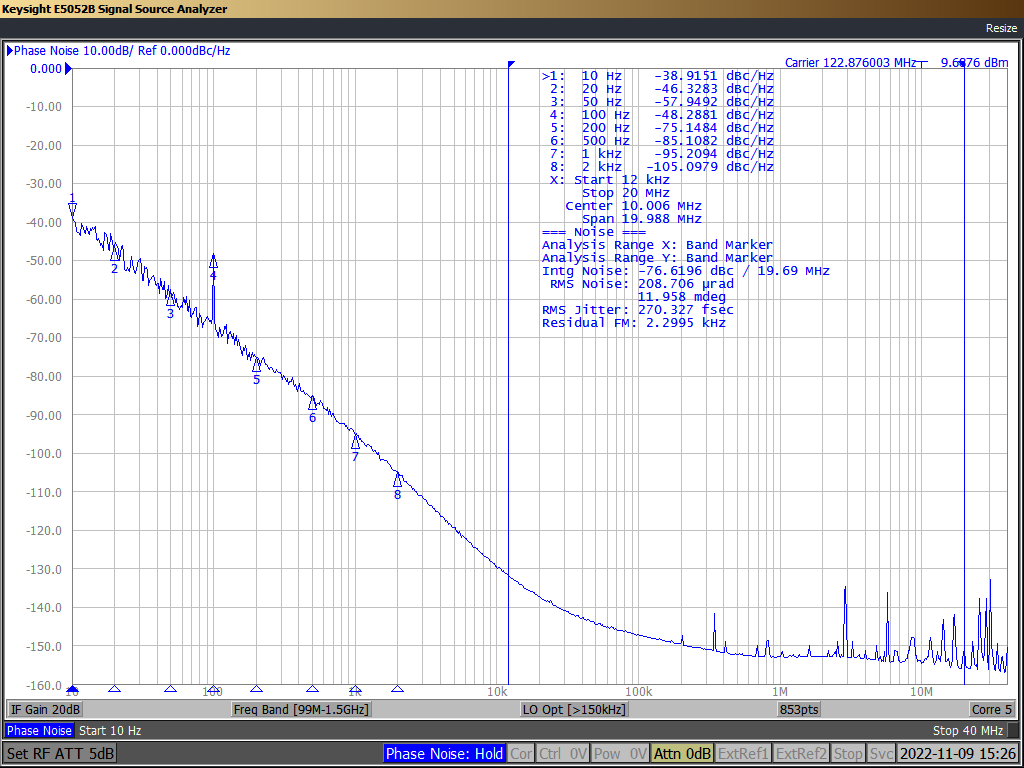 Figure 3-3 Capture of Sinusoidal
Vibration at 100 Hz
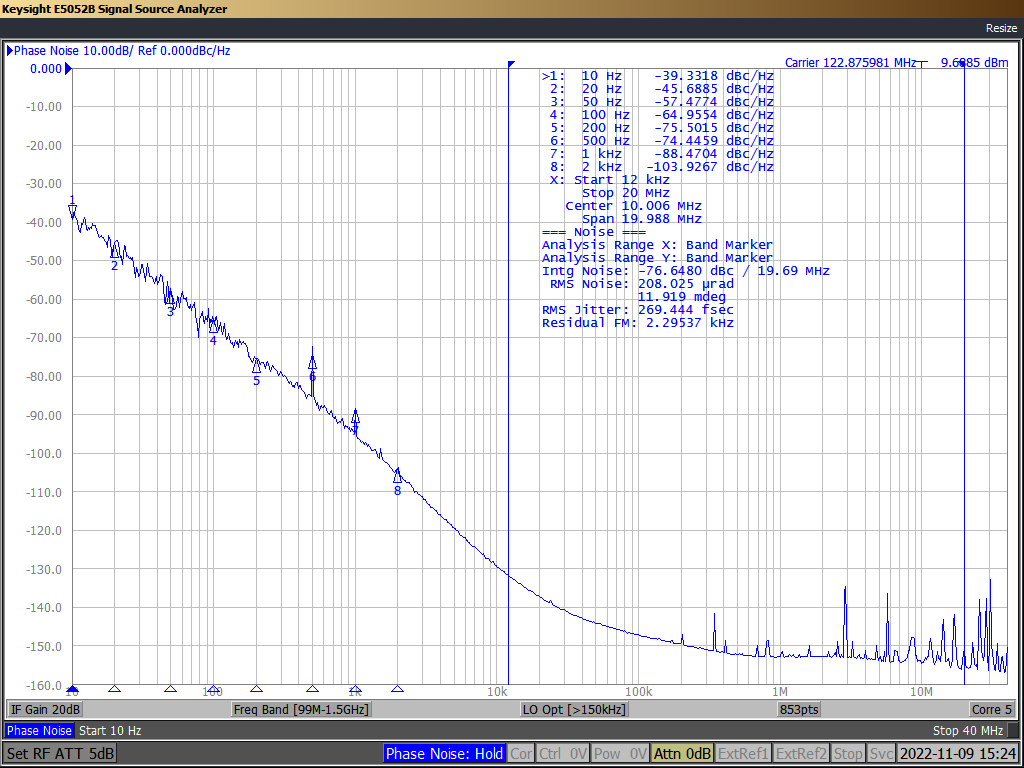 Figure 3-5 Capture of Sinusoidal
Vibration at 500 Hz
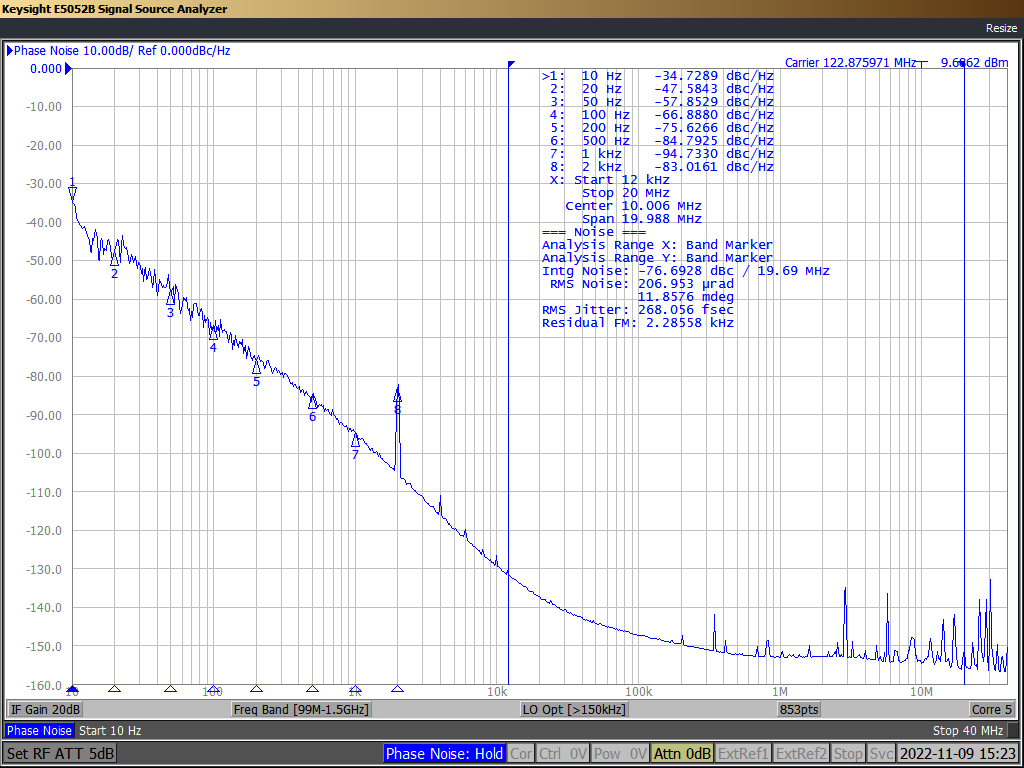 Figure 3-7 Capture of Sinusoidal
Vibration at 2000 Hz
Figure 3-7 Capture of Sinusoidal
Vibration at 2000 HzThe combined, overlaid waveform for the phase noise plots with respect to vibration frequencies are shown in the following figures. The figures show waveforms for the DLE-4, DLF-4, DLE-6, and DLF-6 packages.
The ppb/g is calculated and plotted for both LVCMOS and LVPECL. Each of the following figures show Z-axis data with the device at 10 g acceleration.
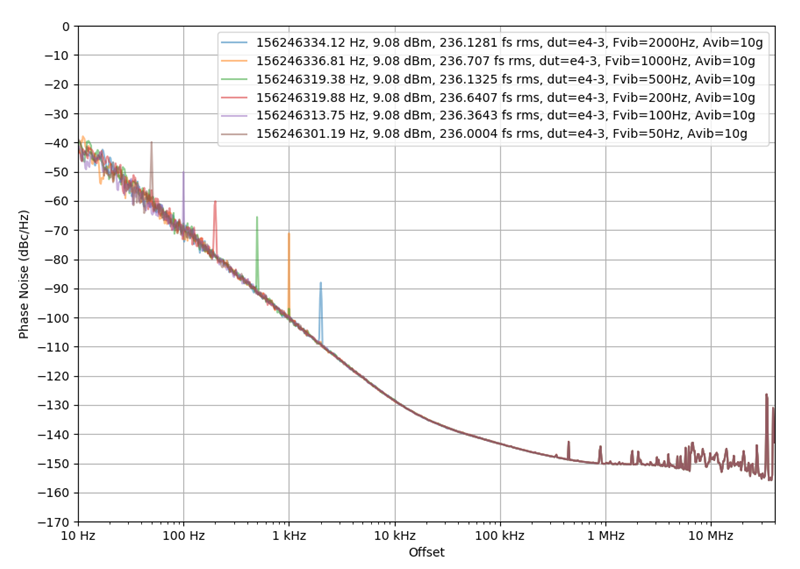 Figure 3-8 Combined Sinusoidal
Vibration Phase Noise Plot on 4-pin DLE Package
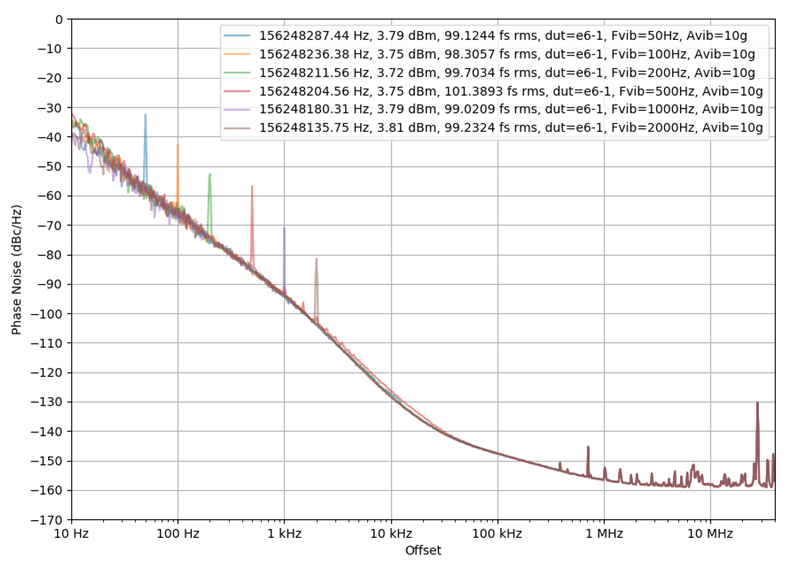 Figure 3-10 Combined Sinusoidal
Vibration Phase Noise Plot on 6-pin DLE Package
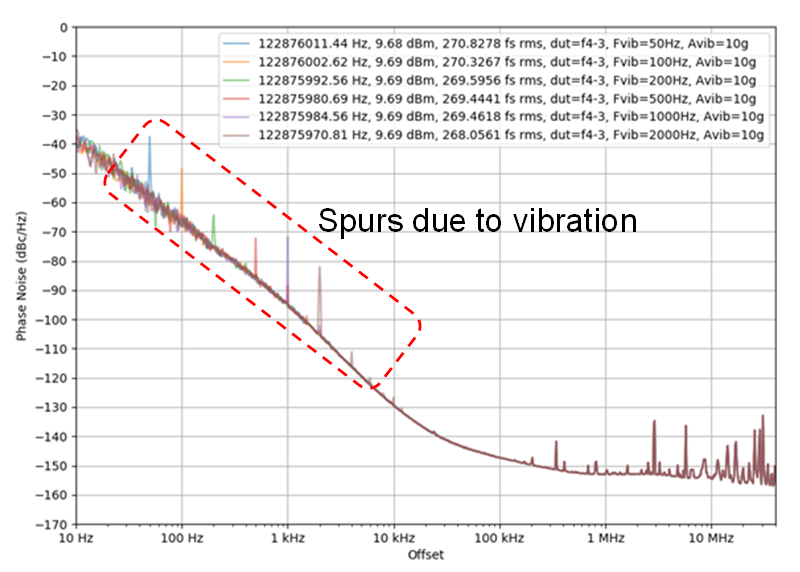 Figure 3-9 Combined Sinusoidal
Vibration Phase Noise Plot on 4-pin DLF Package
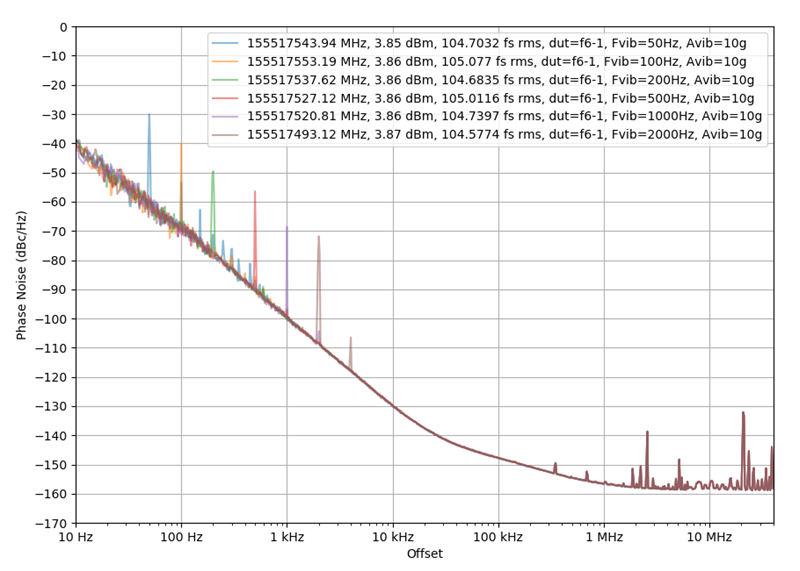 Figure 3-11 Combined Sinusoidal
Vibration Phase Noise Plot on 6-pin DLF Package
Figure 3-11 Combined Sinusoidal
Vibration Phase Noise Plot on 6-pin DLF PackageThe calculated ppb/g values for the LMK6x on LVCMOS and LVPECL devices for both the DLE and DLF packages are plotted for all the tested vibration frequencies. These calculations are based on the vibration frequency spurs in phase noise measurements for various vibration frequencies for different types of LMK6x packages and output types. The equations are provided in Section 3.1.1. Figure 3-12 shows the vibration frequency versus the ppb/g value. The vibration sensitivity of the LMK6x LVCMOS output type is less than 1 ppb/g and the vibration sensitivity for the LMK6x differential output is less than 2 ppb/g based on the plots. In Figure 3-12, the top plot is the X-axis, the middle plot is the Y-axis, and the bottom plot is the Z-axis ppb/g versus the vibration frequency. The blue line in Figure 3-12 represents the DLE package and the green line represents the DLF package. The vibration sensitivity of the crystal oscillators are in the range of 10 ppb/g, which shows that the BAW oscillators have less vibration sensitivity compared to crystal oscillators.
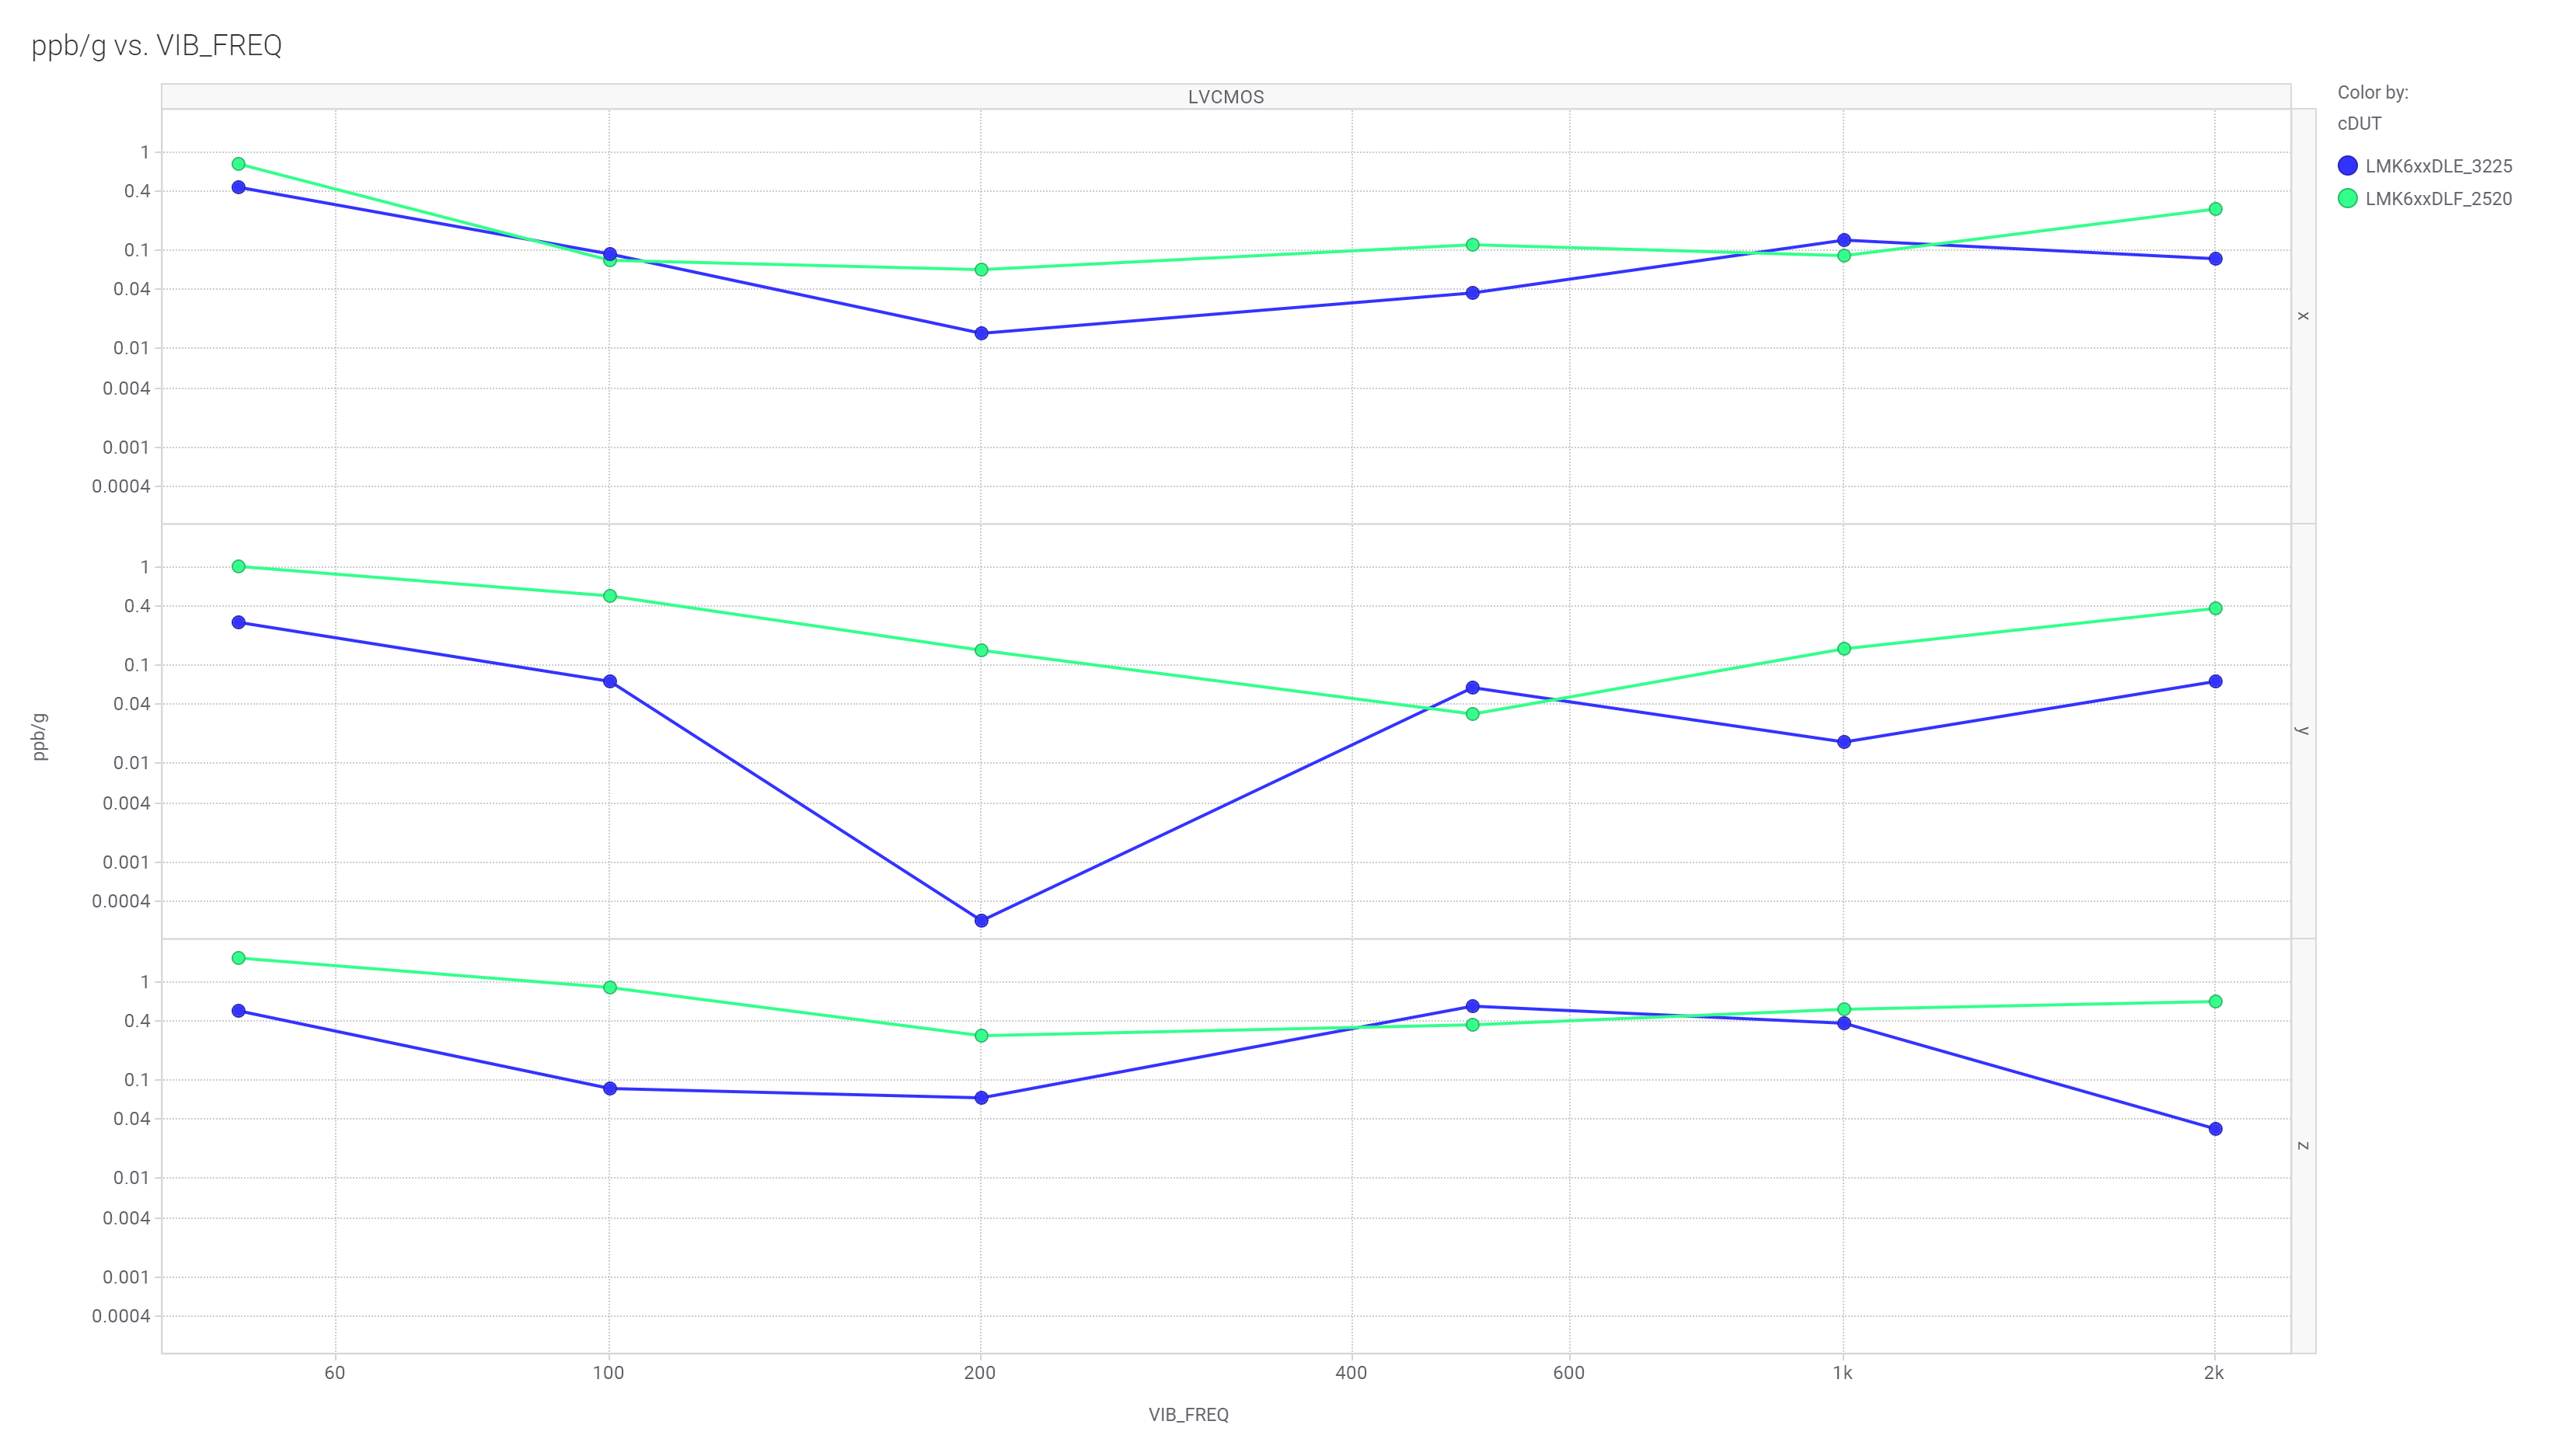 Figure 3-12 ppb/g Versus Vibration
Frequency Plot for LVCMOS Output - DLE and DLF packages - X, Y, Z Axis
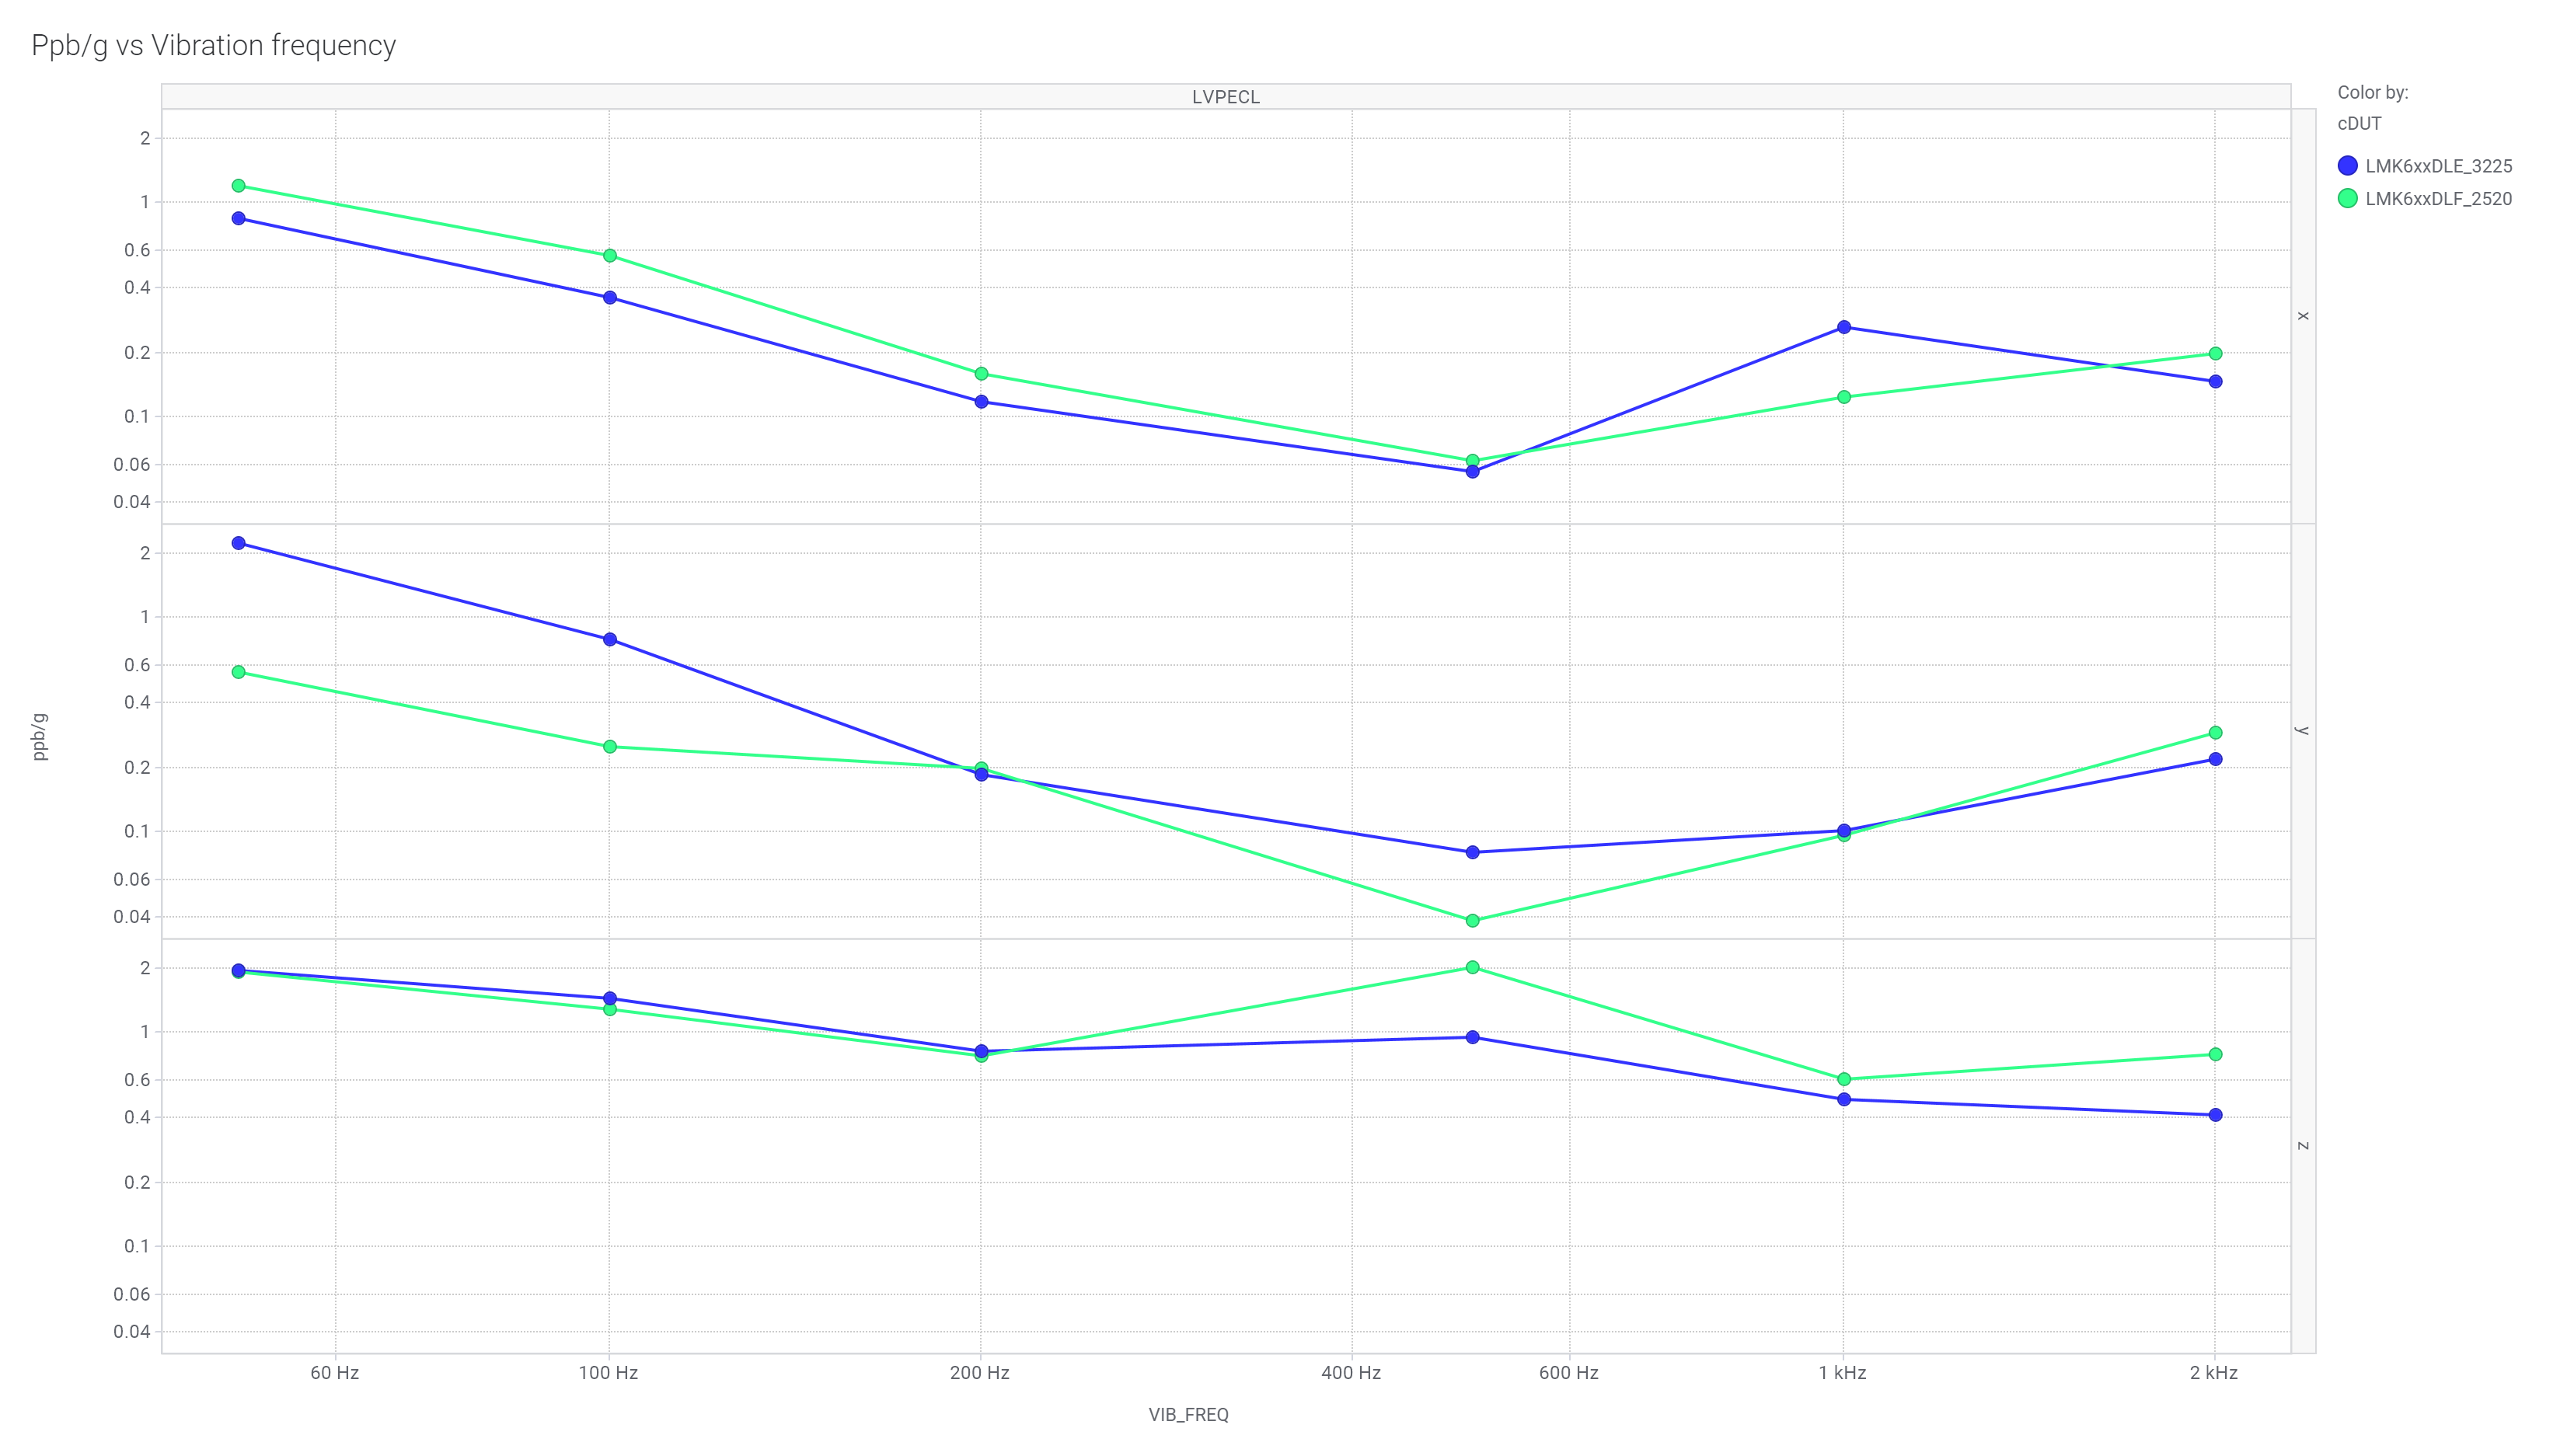 Figure 3-13 ppb/g Versus Vibration
Frequency Plot for Differential Output - DLE and DLF Packages - X, Y, Z
Axis