SLVAEP4 October 2023 BQ79600-Q1 , BQ79612-Q1 , BQ79614-Q1 , BQ79616 , BQ79616-Q1 , BQ79652-Q1 , BQ79654-Q1 , BQ79656-Q1
3.2 Receiver Threshold Requirements
The thresholds at which the internal digital is able to properly detect a high vs. low transition are shown in Figure 3-1. A good quality waveform will have a differential voltage above 1.8 V (and below -1.8 V on the negative side). It typically resembles a square wave with rounded edges.
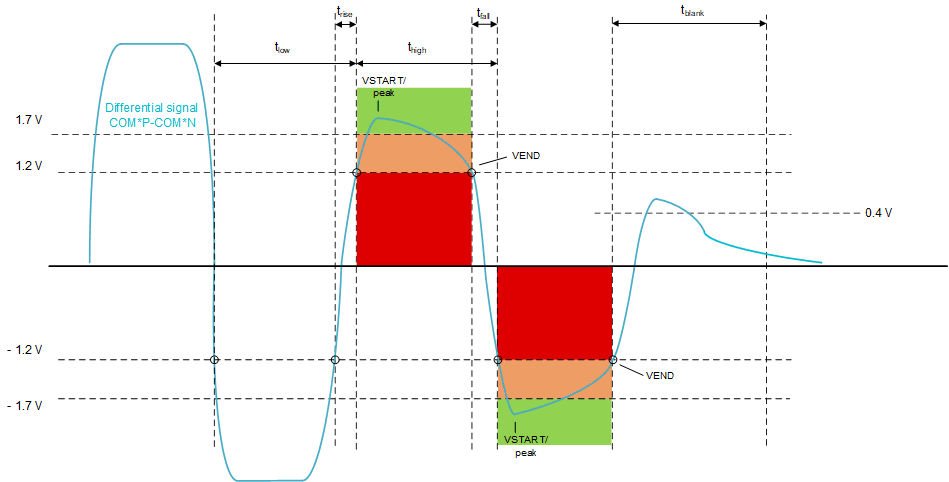
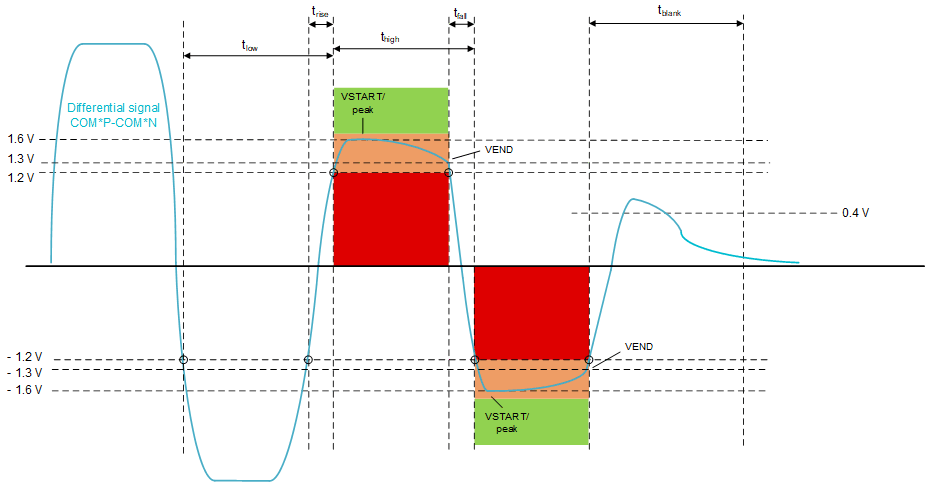
The image below shows a poor quality or drooping waveform that still meets the criteria for a valid communication. The first diagram is showing a starting voltage (VSTART) of 1.7 V with an ending voltage (VEND) of 1.2V. The second diagram shows a second scenario where the starting voltage (VSTART) is only 1.6 V with an ending voltage (VEND) of 1.3V. If the starting amplitude is not at least 1.6 V, then the bit will not be detected, regardless of ending amplitude. These types of drooping waveforms most often are seen when there are two adjacent bits of opposite polarity, forming what can be referred to as a double-bit.
 Figure 3-1 Differential Signal Eye
Diagram - 1.7 V VSTART
 Figure 3-2 Differential Signal Eye
Diagram - 1.6 V VSTART
Figure 3-2 Differential Signal Eye
Diagram - 1.6 V VSTARTTable 3-1 shows the specific timing and voltage requirements for valid daisy-chain communication.
| Parameter | Conditions | Min | Typ | Max | |
|---|---|---|---|---|---|
| thigh | positive pulse width | COMP-COMN from +1.2V of rising edge to -1.2V of next falling edge | 220 ns | 250 ns | 280 ns |
| tlow | negative pulse width | COMP-COMN from -1.2V of rising edge to +1.2V of next falling edge | 220 ns | 250 ns | 280 ns |
| trise | Rising slew rate | COMP-COMN from -1.2V to +1.2V of rising edge | 60 ns | ||
| tfall | Falling slew rate | COMP-COMN from +1.2V to -1.2V of falling edge | 60 ns | ||
| Vstart | Starting amplitude | If ending amplitude is above 1.3V | 1.6 V | ||
| Vstart | Starting amplitude | If ending amplitude is between 1.2V and 1.3V | 1.7 V | ||
| tblank | Blanking time | After last bit | 4 us | ||
| Wake Tone (thigh/tlow) | Wake Tone pulse widths | COMP-COMN from +1.2V of rising edge to -1.2V of next falling edge during and vice versa for Wake tones | 1 us |
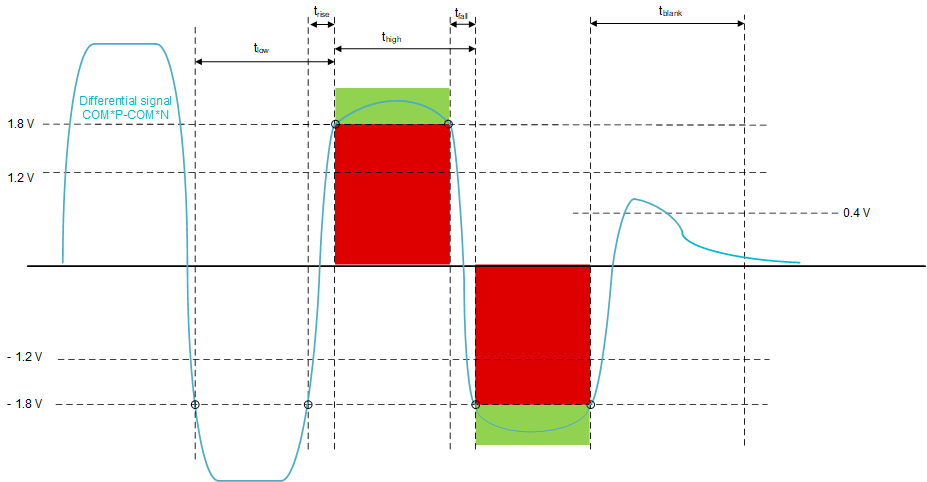
Figure 3-3 shows the threshold needed for interfacing with the BQ79600 device. The primary difference is the threshold and timing references are based on a 1.8 V threshold.
 Figure 3-3 Differential Signal Eye Diagram - BQ79600