SLVUBT1A October 2019 – June 2020 TPS50601A-SP
4.1 Monte Carlo Analysis of Output Voltage
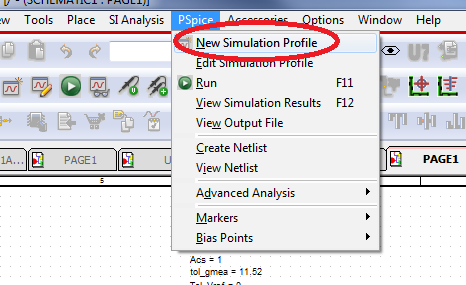
- Create a new simulation profile by clicking on PSpice → New Simulation Profile and give it a name.
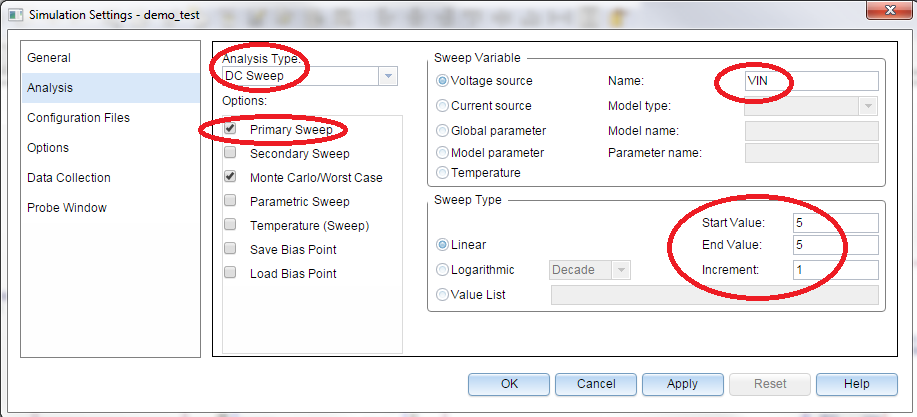
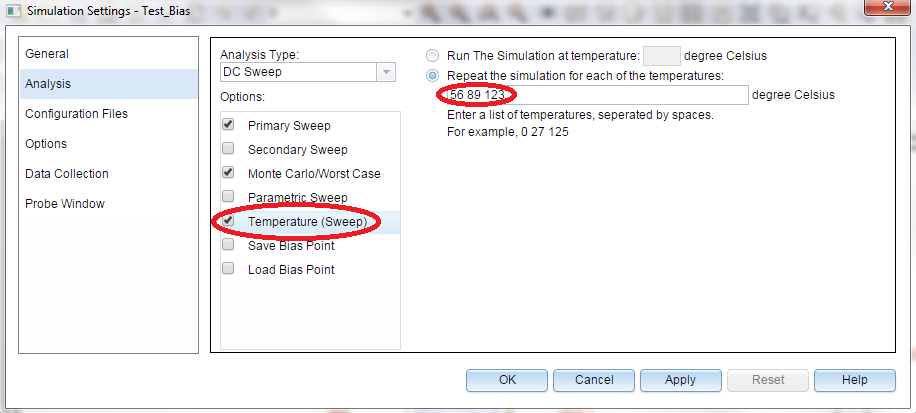
- Set the parameters based on the image below using the following settings:
- Analysis Type - DC-Sweep
- Primary Sweep - VIN (Input Voltage) from 5 V to 5 V
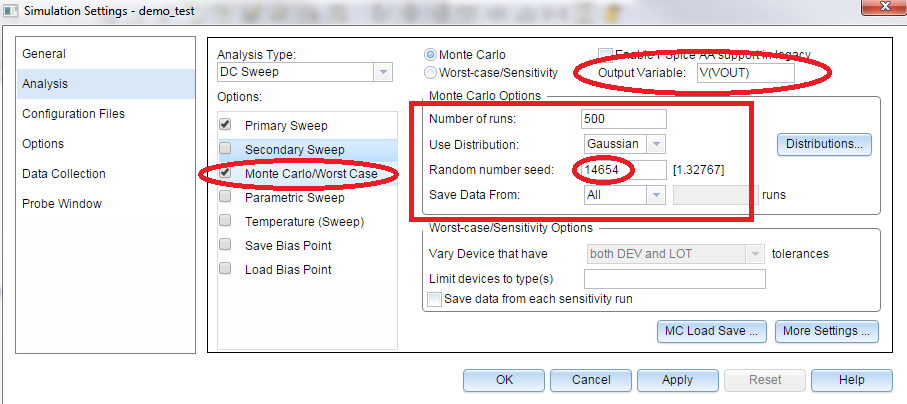
- Monte Carlo - 500 runs with Gaussian distribution
- Output Variable - V(VOUT) - Output Voltage
- Set the random seed number for Monte Carlo within the range shown to the right of the entry box.
- Run the simulation by pressing F11 or PSpice → Run.
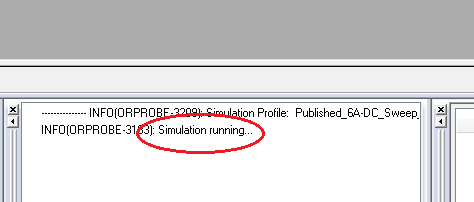
- Wait for the simulation completion in the console window of AMS Simulator.
The simulation can be performed at various temperatures by selecting temperature sweep in the simulation profile and setting the temperature values in ascending order.
The output windows come up once the simulation is completed. The results window shows the histogram of the output voltage (V(VOUT)) with Monte Carlo analysis. The mean, sigma, min, max, etc. are displayed at the bottom of the window.
 Figure 2. Output Voltage Monte Carlo Analysis
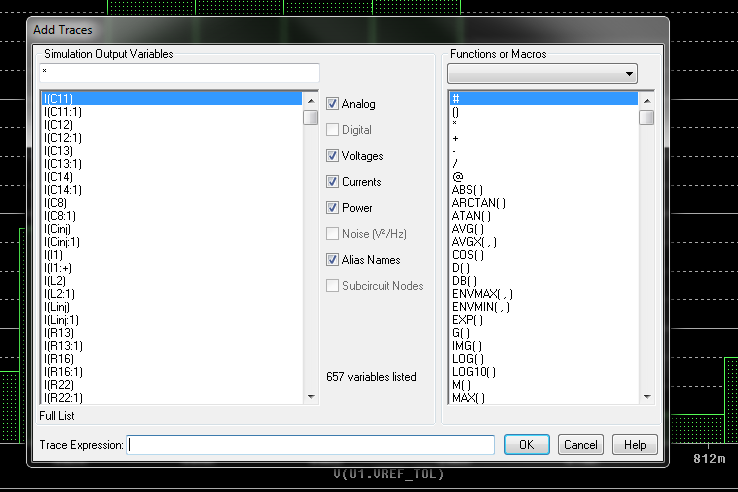
 To analyze other nodes, click on Trace → Add Trace.
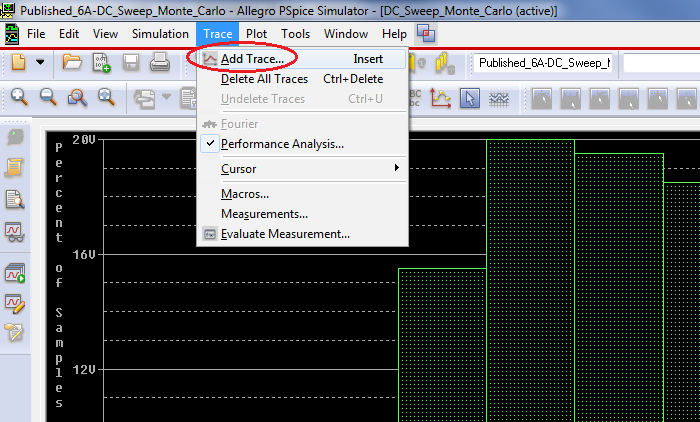
This will bring in another pop-up with the netlist present in the schematics. Select the desired trace and click "OK". The histogram of the selected node will be updated.