TIDUF63 December 2023
- 1
- Description
- Resources
- Features
- Applications
- 6
- 1System Description
- 2System Design Theory
-
3System Overview
- 3.1 Block Diagram
- 3.2 Design Considerations
- 3.3
Highlighted Products
- 3.3.1 TMDSCNCD280039C - TMS320F280039C Evaluation Module C2000™ MCU controlCARD™
- 3.3.2 LMG3522R050 - 650-V 50-mΩ GaN FET With Integrated Driver
- 3.3.3 LMG2100R044 - 100-V, 35-A GaN Half-Bridge Power Stage
- 3.3.4 TMCS1123 - Precision Hall-Effect Current Sensor
- 3.3.5 AMC1302 - Precision, ±50-mV Input, Reinforced Isolated Amplifier
- 3.3.6 AMC3330 - Precision, ±1-V Input, Reinforced Isolated Amplifier With Integrated DC/DC Converter
- 3.3.7 AMC1311 - High-Impedance, 2-V Input, Reinforced Isolated Amplifier
- 3.3.8 ISO6741 - General-Purpose Reinforced Quad-Channel Digital Isolators with Robust EMC
- 3.3.9 UCC21540 - Reinforced Isolation Dual-Channel Gate Driver
- 3.3.10 LM5164 - 100-V Input, 1-A Synchronous Buck DC/DC Converter with Ultra-low IQ
- 4Hardware, Software, Testing Requirements, and Test Results
- 5Design and Documentation Support
- 6About the Author
2.2 MPPT Operation
The power output from a PV panel depends on a few parameters, such as the irradiation received by the panel, panel voltage, panel temperature, and so forth. The power output also varies continuously throughout the day as the conditions affecting the change.
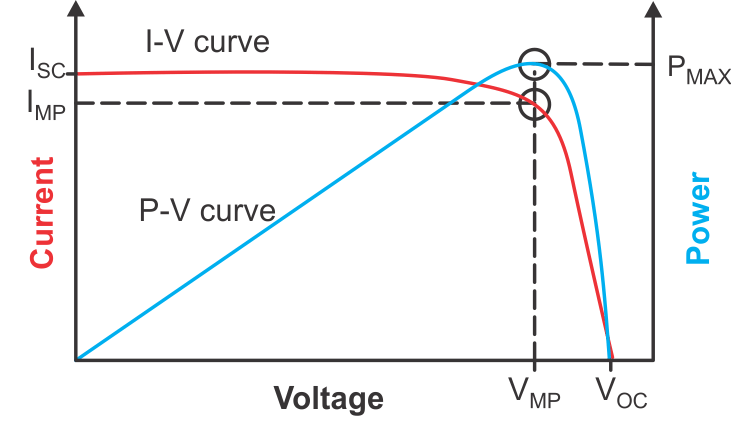
Figure 2-1 shows the I-V curve and the P-V curve of a solar panel. The I-V curve represents the relationship between the panel output current and the output voltage. As the I-V curve in the figure shows, the panel current is at the maximum when the terminals are shorted and is at the lowest when the terminals are open and unloaded.
 Figure 2-1 Solar Panel Characteristics I-V and P-V Curves
As shown, the maximum power obtained from the panel represented as PMAX at a point when the product of the panel voltage and the panel current is at the maximum. This point is designated as the maximum power point (MPP).
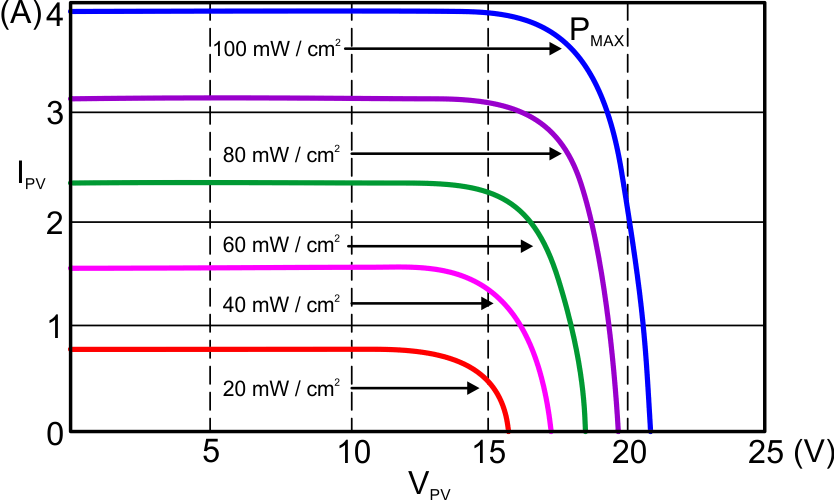
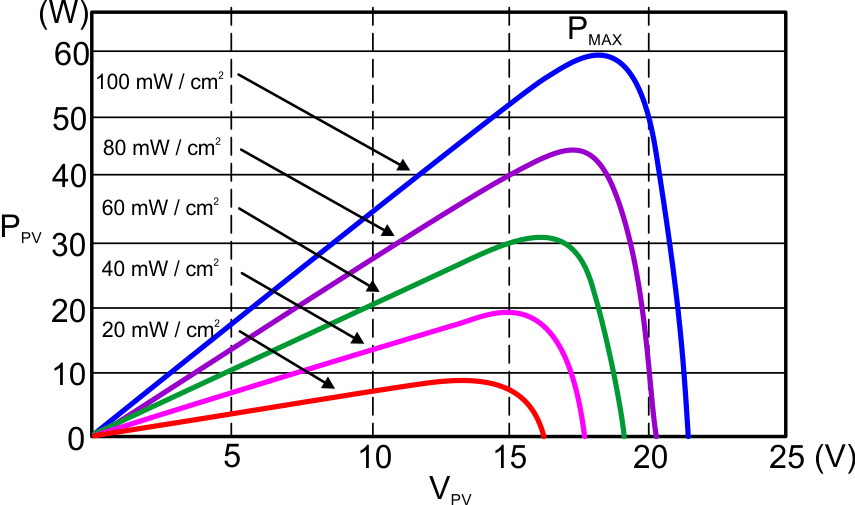
The graphs below show examples of how each of the various parameters affect the output power from the solar panel. The graphs also show the variation in the power output of a solar panel as a function of irradiance. Observe in these graphs how the power output from a solar panel increases with the increase in irradiance and decreases with a decrease in irradiance. Also note that the panel voltage at which the MPP occurs also shifts with the change in irradiance.
 Figure 2-2 Solar Panel Output Power Variation Under Different Irradiation Conditions—Graph A
 Figure 2-3 Solar Panel Output Power Variation Under Different Irradiation Conditions—Graph B
The challenge of automatically identifying the MPP of the panel is typically performed by employing MPPT algorithms in the system. The MPPT algorithm tries to operate the photovoltaic panel at the maximum power point and uses a switching power stage to supply the load with the power extracted from the panel.
Perturb and Observe (PO) is one of the most popular MPPT algorithms used. The fundamental principle behind this algorithm is simple and easy to implement in a microcontroller based system. The process involves slightly increasing or decreasing (perturbing) the operating voltage of a panel. Perturbing the panel voltage is accomplished by changing the duty cycle of the converter. Assuming that the panel voltage has been slightly increased and that this leads to an increase in the panel power, then another perturbation in the same direction is performed. If the increase in the panel voltage decreases the panel power, then a perturbation in the negative direction is done to slightly lower the panel voltage.
By performing the perturbations and observing the power output, the system begins to operate close to the MPP of the panel with slight oscillations around the MPP. The size of the perturbations determines how close the system is operating to the MPP. Occasionally this algorithm can become stuck in the local maxima instead of the global maxima, but this problem can be solved with minor tweaks to the algorithm.
The PO algorithm is easy to implement and effective, and was chosen for this design.