SNLA224A June 2014 – January 2024 DS90UB913A-Q1 , DS90UB954-Q1 , DS90UB960-Q1
2.1 Inductor Characteristics
An ideal inductor is capable of blocking all AC frequencies and passing all DC power. However, inductors have characteristics that make them behave less like an inductor in extreme circumstances. Real-world inductors behave more closely to the circuit shown in Figure 2-2 with parasitic capacitance and resistance components. At low frequencies, the capacitor acts like an open circuit with high impedance, and the inductor acts like a short circuit with low impedance. At very high frequencies, the capacitor acts like a short circuit, at which point the impedance is equal to RL.
 Figure 2-2 Model for
a Real-World Inductor
Figure 2-2 Model for
a Real-World InductorThe impedance peaks at the self-resonant frequency (SRF) where the inductor and capacitor resonate. At frequencies past the SRF, the parasitic capacitance takes over and lowers the impedance. The SRF can be calculated using Equation 1, where L is the inductance, C is the parasitic capacitance, and F is the resonant frequency. These values are typically listed in the component's data sheet.
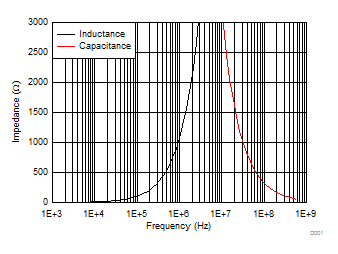
The impedance of a 100 µH inductor is shown in Figure 2-3 where the black line shows the impedance of an ideal inductor before the SRF and the red line shows the impedance of the parasitic capacitance after the SRF.
 Figure 2-3 Real-world Inductor Impedance - 100 µH Inductor
Figure 2-3 shows that for a 100 µH inductor, the impedance rises above 1 kΩ at about 1 MHz and drops below 1 kΩ above frequencies of about 30 MHz. Although not strictly required, an impedance above 1 kΩ is recommended as high impedance correlates to lower signal loss. For this reason, a more complex low pass filter is required to raise the impedance over the entire FPD-Link bidirectional signaling frequency range.
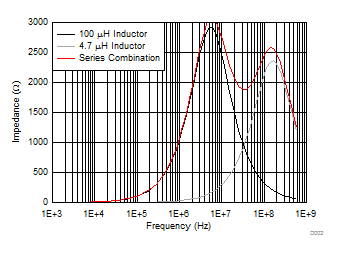
To increase the impedance of the circuit over the entire operational frequency range, additional inductive components of different values can be added in series. Figure 2-4 shows the impedance of a 100 µH and 4.7 µH inductor individually and in series. Compared to the 100 µH inductor the 4.7 µH inductor has a higher SRF but still does not achieve a high impedance across a large frequency range. However, when used in series, the impedance remains above 1 kΩ from about 1 MHz to well over 500 MHz.
 Figure 2-4 Impedance of Series Inductors
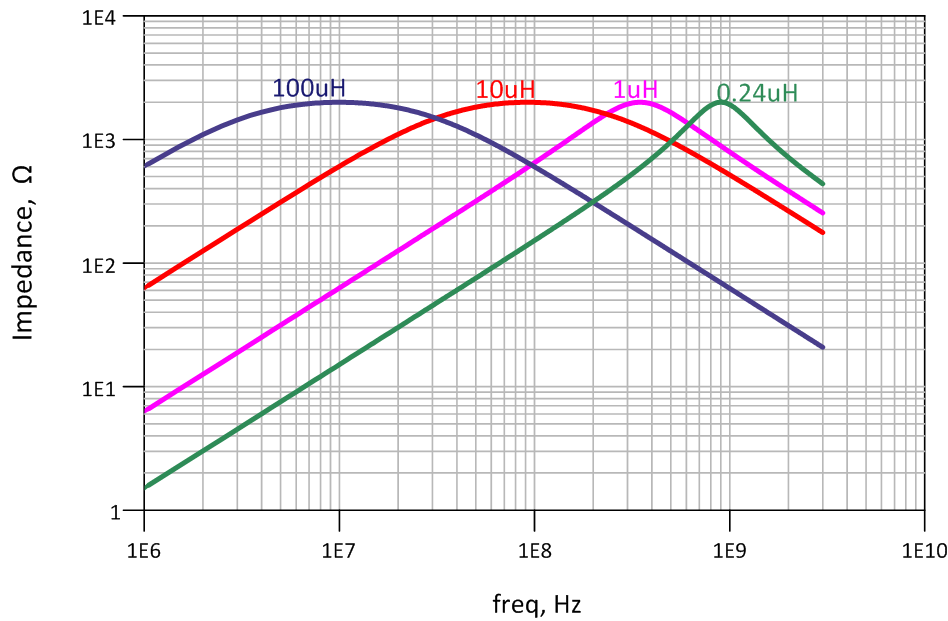
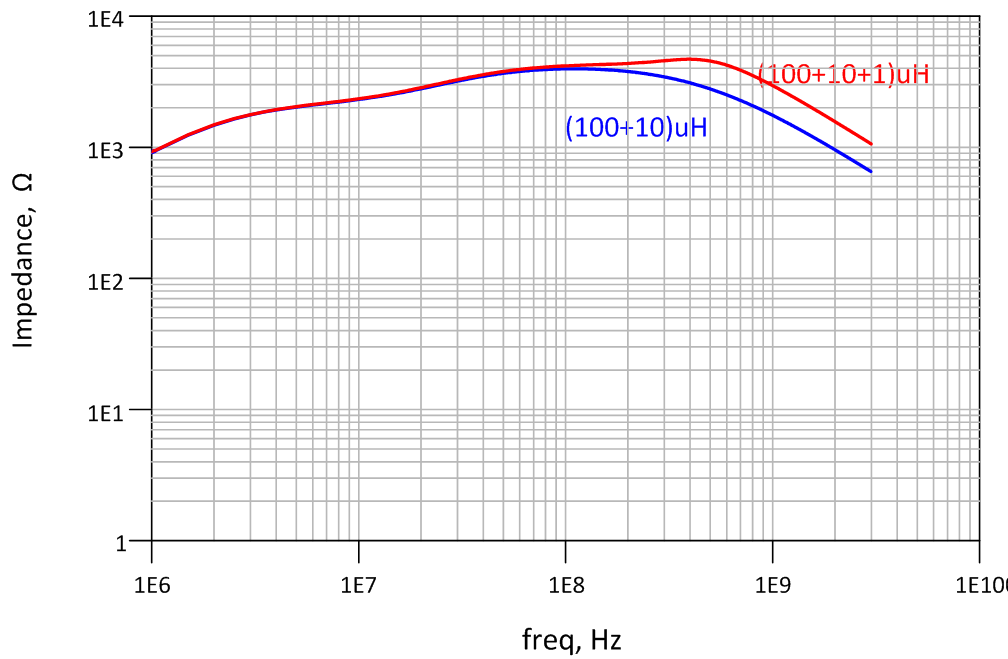
By cascading inductors in series, a wide-bandwidth inductor can be created to cover the entire range of frequencies across the back channel and the forward channel. This is demonstrated further in Figure 2-5 and Figure 2-6. Figure 2-5 shows impedance graphed for individual inductors of various values. The individual inductors do not provide an impedance of 1 kΩ over a wide frequency range. However, Figure 2-6 shows that when combined, the inductors provide consistent impedance of 1 kΩ over a large frequency range.
 Figure 2-5 Impedance of Individual
Inductors
 Figure 2-6 Impedance of Combined
Inductors
Figure 2-6 Impedance of Combined
InductorsAn additional consideration when working with real-world inductors is the saturation current. Inductors store electrical energy in the form of a magnetic field. The strength of the magnetic field is correlated to the current flowing through the inductor. The saturation current is the maximum current that can be supported before the inductor ceases to behave like an ideal inductor. When implementing a PoC network, it is crucial to verify that the operating conditions do not exceed the max rated electrical characteristics of any component.