SPRACT7 August 2020 TMS320F280021 , TMS320F280021-Q1 , TMS320F280023 , TMS320F280023-Q1 , TMS320F280023C , TMS320F280025 , TMS320F280025-Q1 , TMS320F280025C , TMS320F280025C-Q1 , TMS320F280040-Q1 , TMS320F280040C-Q1 , TMS320F280041 , TMS320F280041-Q1 , TMS320F280041C , TMS320F280041C-Q1 , TMS320F280045 , TMS320F280048-Q1 , TMS320F280048C-Q1 , TMS320F280049 , TMS320F280049-Q1 , TMS320F280049C , TMS320F280049C-Q1
6 Test Results
Figure 6-1 shows the motor test setup used for verifying single-shunt solution. The inverter board used for this testing is DRV8312EVM_revD that has a shunt resistor in the inverter dc-link side as well as thee shunt resistors in FET low side. Also, F280049C controlCARD and TMDSADAP180TO100 adapter card was used for this test.
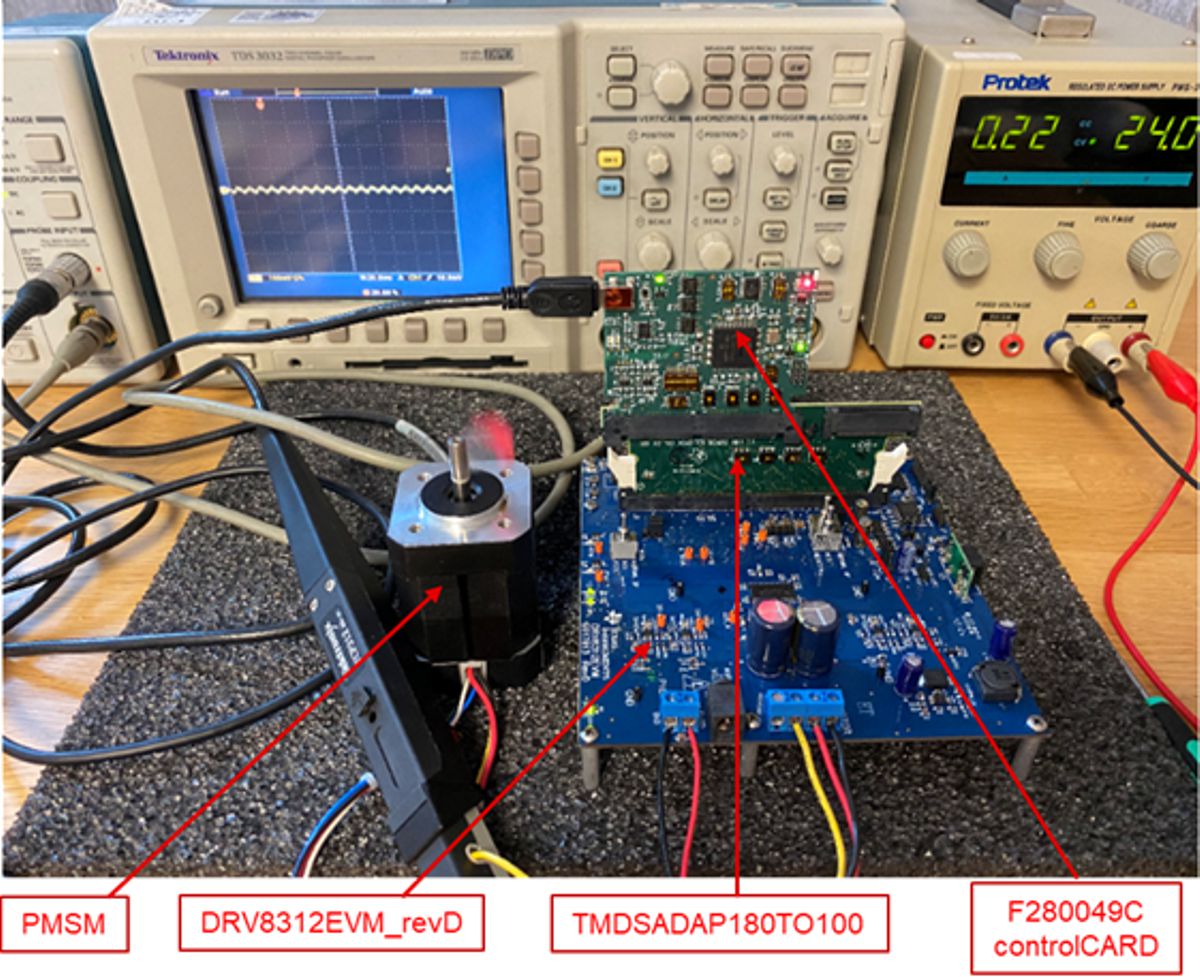 Figure 6-1 Motor Test Setup
In other to verify the proposed solution in this application report, firstly open-loop control which is called V/F without current control was carried out.
The delay time in current sensing loop for the inverter board used in this test is as following
- Tr = 100 ns (Rise time of amplifier including power switches(MOSFET/IGBT) turn on time)
- Ts = 100 ns (Settling time of amplifier)
- TS&H = 170 ns (ADC Sample and Hold time, 1 + (14) + 2 = 17 SYSCLK)
- TDT = 10 ns (Dead-time between top and bottom switch)
- TPD = 38 ns (Gate driver propagation delay)
From Equation 2 and Equation 3, the two critical parameters for dc-link current sampling can be calculated as following.
| T_MinAVDuration | = TDT + Tr + Ts + TS&H |
| = 10 + 100 + 100 + 170 = 380 ns => 38 SYSCLK cycles (@100 MHz) | |
| T_SampleDelay | = TDT + TPD + Tr + Ts |
| = 10 + 38 + 100 + 100 = 248 ns => 25 SYSCLK cycles (@100 MHz) |
Figure 6-2 shows dc-link current measured at the voltage vector of sector 1. Because the T_SampleDelay is set as 25 SYSCLK (250 nsec), the first ADC SOC is triggered after 250 nsec based on the falling edge of PWMC_TOP (SCH). It was confirmed that a clean signal can be sampled and converted by ADC without switching noise at the sensing point.
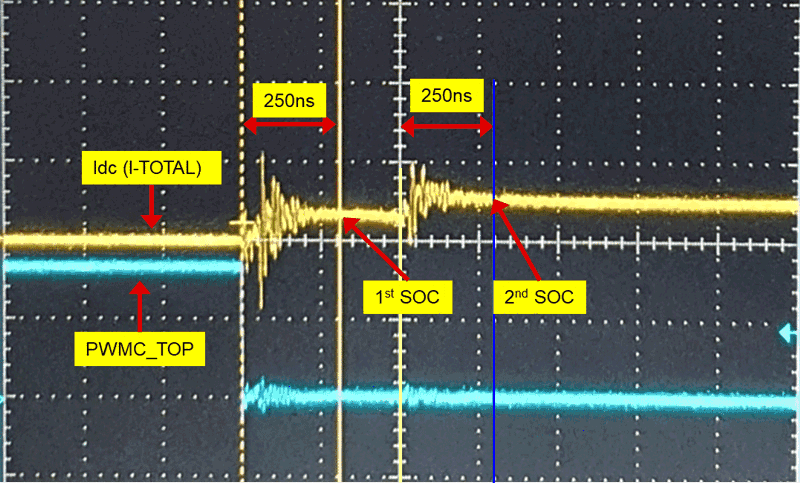 Figure 6-2 DC-Link Current (@ sector 1, Vdref
= 1 V, Vqref = 0 V), 200 ns/div
Figure 6-2 DC-Link Current (@ sector 1, Vdref
= 1 V, Vqref = 0 V), 200 ns/divFigure 6-3 and Figure 6-4 show before and after applying the PWM compensation, respectively. Figure 6-3 shows the reconstructed phase current from dc link current without PWM compensation. This waveform has lots of distortion because the current are not properly measured at the output vector that has a small active duration less than a minimum active duration.
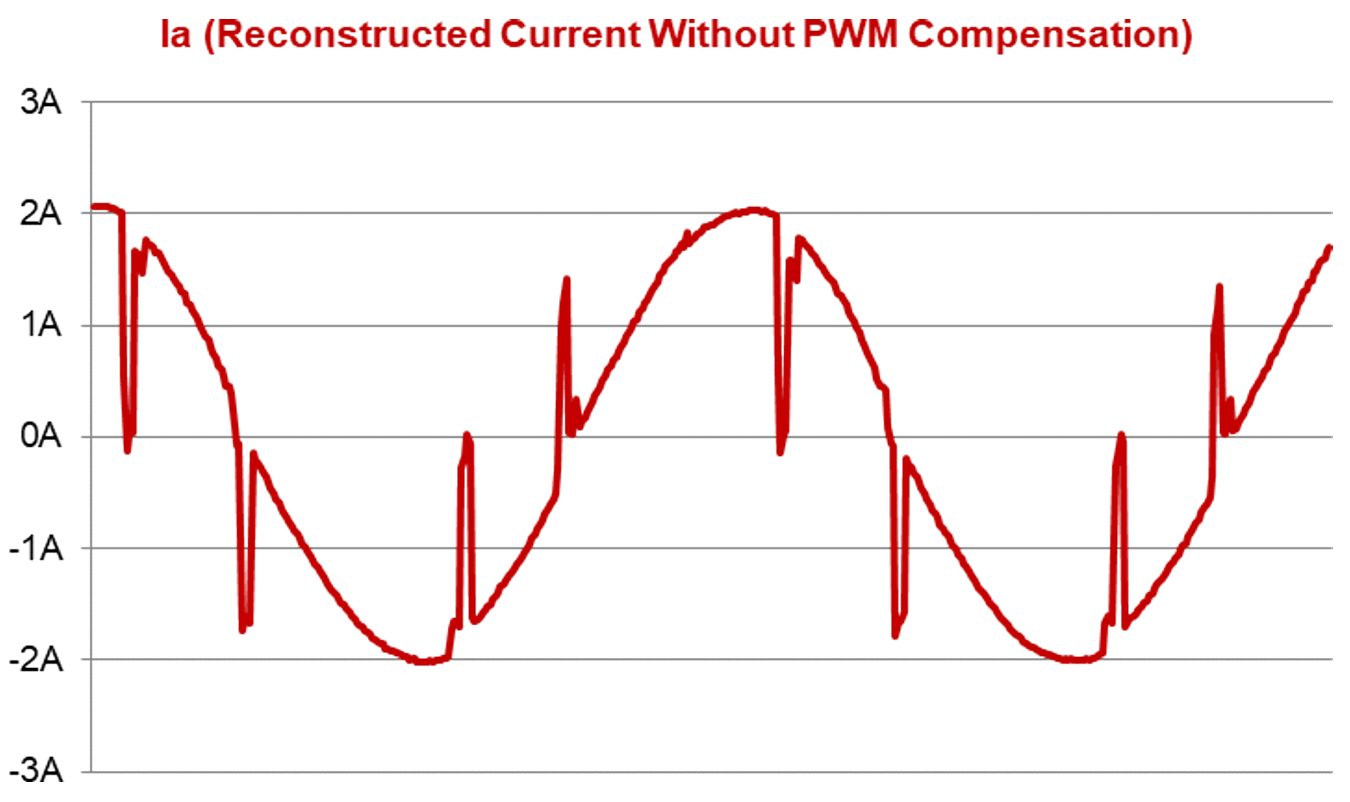 Figure 6-3 Reconstructed Phase Current
Without PWM Compensation During Open-Loop V/F Operation (1.4V/20Hz)
 On the contrary, Figure 6-4 shows the reconstructed phase motor current with PWM phase shift compensation described in Section 3.2. It shows that the phase current is reconstructed without any current distortion.
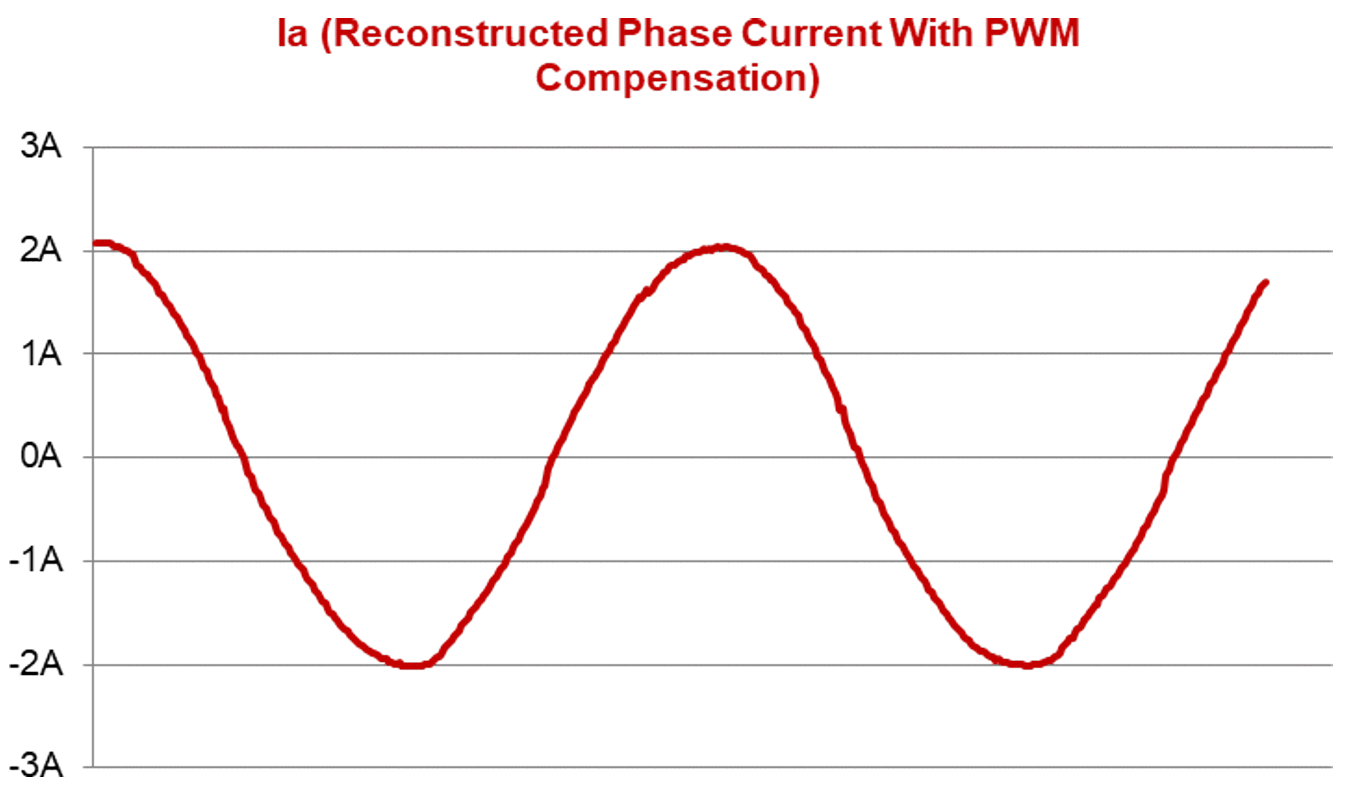 Figure 6-4 Reconstructed Phase Current With
PWM Phase Shift Compensation During Open-Loop V/F Operation (1.4V/20Hz)
Figure 6-4 Reconstructed Phase Current With
PWM Phase Shift Compensation During Open-Loop V/F Operation (1.4V/20Hz)Figure 6-5 shows a measured oscilloscope waveform of phase-A current while running at 30Hz with closed-loop current and speed PI regulator. Since no load current of the motor used in this test is too small to determine whether PWM compensation and current reconstruction algorithm work well, it was measured by applying some loads to the motor shaft by hand.
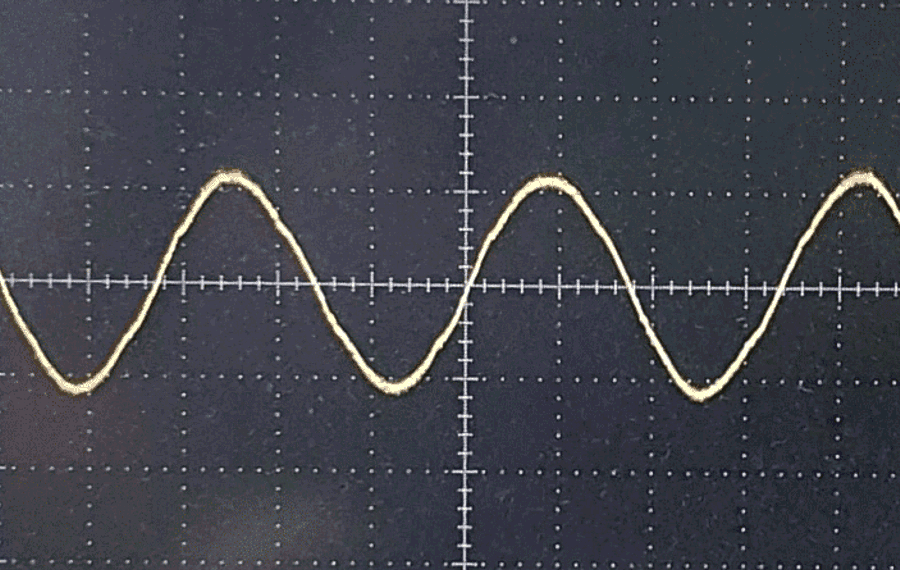 Figure 6-5 Measured Current in Phase A During
Steady-State Operation at 30Hz (10ms/div, 1A/div)
Figure 6-5 Measured Current in Phase A During
Steady-State Operation at 30Hz (10ms/div, 1A/div)Figure 6-6 shows reconstructed phase current captured from MCU during operation at 30Hz same as Figure 6-5. The Figure 6-5 and Figure 6-6 are almost identical waveform. It means that the PWM compensation and current reconstruction algorithm in this application report work well in load condition.
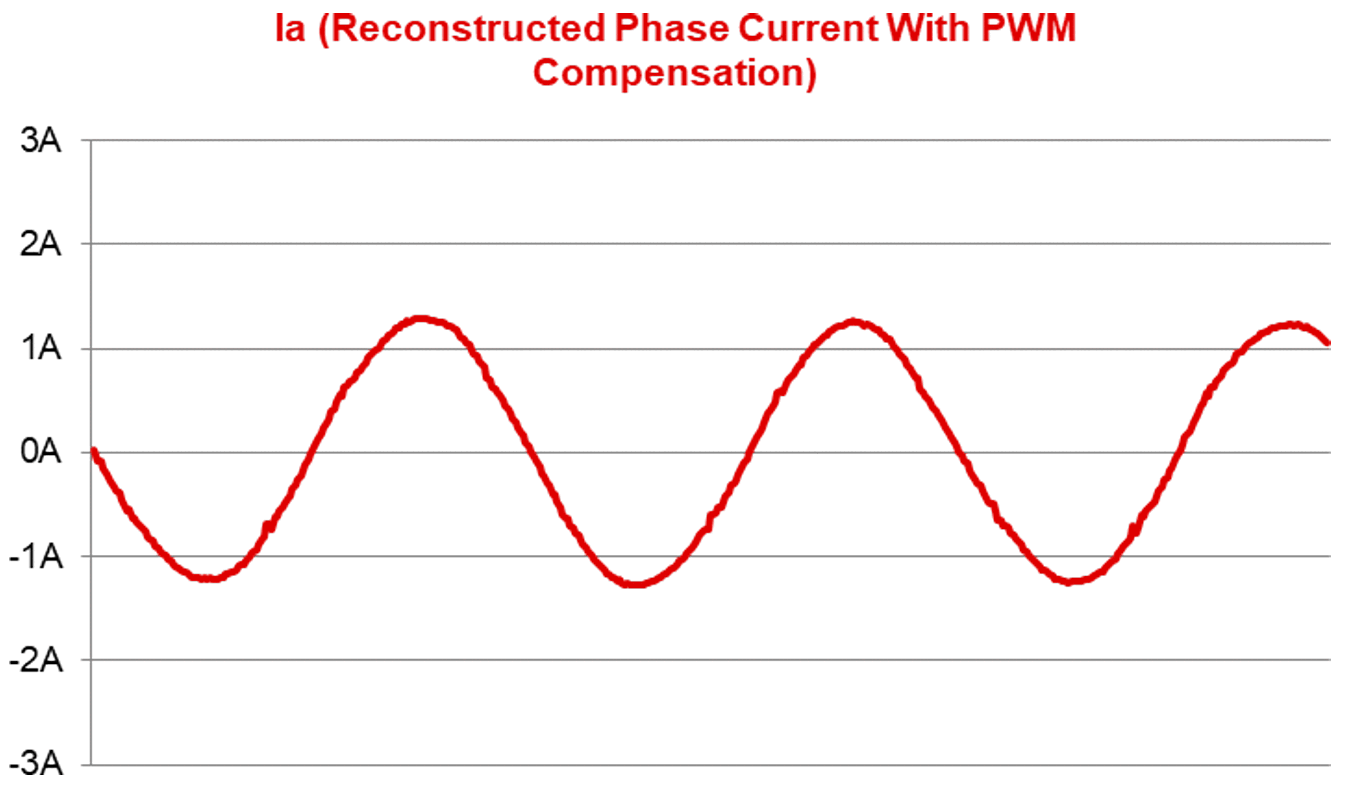 Figure 6-6 Reconstructed Current in Phase A
During Steady-State Operation at 30Hz