TIDUEU6B September 2020 – December 2021 OPA810
- Description
- Resources
- Features
- Applications
- 5
- 1System Description
- 2System Overview
- 3Hardware, Software, Testing Requirements, and Test Results
- 4Design Files
- 5Software Files
- 6Related Documentation
- 7Revision History
3.2.2 Test Results
The following example shows the unknown capacitive impedance measurement in detail.
Component : C = 100 nF
Measured value of the C = 99.472 nF
Frequency of Test = 1 kHz
RG = RF Setting = 100 Ω
Calibrated value of RF = 99.97686
RF/ZX = 0.062412398 and α = 90.125° ( phase of the ratio)
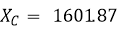
Thus, ZX = 1601.875005 and θX = 90.125°


Using Equation 21 we get, C = 99.3556 nF

Thus the % Error = 0.116 %
All other components are measured in the same way. The results are shown in Table 3-4.
It should be noted that the errors are estimated with respect to the value estimated by Keysight Technologies’ E4980A precision LCR Meter. For testing, an input of 3.6 Vpp was used and results were measured with a seperate board utilizing the THS4551 and ADS9224R.
| Parameters | RG = RF Setting | ||||||
|---|---|---|---|---|---|---|---|
| Frequency (Hz) | Component | 100 Ω | Error(%) | 5 kΩ | Error(%) | 100 kΩ | Error(%) |
| 100 | R | 1 Ω – 900 Ω | 0.74 | 500 Ω – 50 kΩ | 0.11 | 10 kΩ – 10 MΩ | 0.3 |
| L | 1.59 mH – 2.38 H | 1.18 | 2.27 H – 79.5 H | - | 72.9 H – 1432 H | - | |
| C | 1.05 µF – 1.59 mF | 3 | 31.78 nF - 1.11 µF | 0.62 | 1.76 nF - 34.7 nF | 0.36 | |
| 1k | R | 1 Ω – 900 Ω | 0.72 | 500 Ω – 50 kΩ | 0.12 | 10 kΩ – 10 MΩ | 0.56 |
| L | 159 µH – 238 mH | 0.47 | 227 mH – 7.95 H | - | 7.29 H – 143.23 H | - | |
| C | 106 nF – 159 µF | 0.12 | 3.178 nF – 111 nF | 0.39 | 176 pF – 3.47 nF | 0.1 | |
| 10k | R | 1 Ω – 900 Ω | 0.71 | 500 Ω – 50 kΩ | 0.12 | 10 kΩ – 10 MΩ | 2.49 |
| L | 25.9 µH – 23.8 mH | 0.57 | 22.6 mH – 795 mH | 1.81 | 729 mH – 14.3 H | - | |
| C | 10.6 nF – 15.9 µF | 0.94 | 317.8 pF – 11.1 nF | 0.4 | 17.6 pF – 347 pF | 0.22 | |
| 100k | R | 1 Ω – 900 Ω | 0.47 | 500 Ω – 50 kΩ | 0.87 | 10 kΩ – 10 MΩ | 14 |
| L | 2.59 µH – 2.38 mH | 0.71 | 2.26 mH – 79.6 mH | 4.8 | 72 mH – 1.43 H | - | |
| C | 1.06 nF – 1.59 µF | 0.17 | 31.78 pF - 1.11 nF | 1.8 | 1.76 pF- 34.7 pF | 5.5 | |