SBASB73 August   2026 AFE7903-SEP

PRODMIX  

  1.   1
  2. 1Features
  3. 2Applications
  4. 3Description
  5. 4Specifications
    1. 4.1  Absolute Maximum Ratings
    2. 4.2  ESD Ratings
    3. 4.3  Recommended Operating Conditions
    4. 4.4  Thermal Information
    5. 4.5  Transmitter Electrical Characteristics
    6. 4.6  RF ADC Electrical Characteristics
    7. 4.7  PLL/VCO/Clock Electrical Characteristics
    8. 4.8  Digital Electrical Characteristics
    9. 4.9  Power Supply Electrical Characteristics
    10. 4.10 Timing Requirements
    11. 4.11 Switching Characteristics
    12. 4.12 Typical Characteristics
      1. 4.12.1  RX Typical Characteristics 30MHz and 400MHz
      2. 4.12.2  RX Typical Characteristics at 800MHz
      3. 4.12.3  RX Typical Characteristics 1.75GHz to 1.9GHz
      4. 4.12.4  RX Typical Characteristics 2.6GHz
      5. 4.12.5  RX Typical Characteristics 3.5GHz
      6. 4.12.6  RX Typical Characteristics 4.9GHz
      7. 4.12.7  RX Typical Characteristics 6.8GHz
      8. 4.12.8  TX Typical Characteristics at 30MHz and 600MHz
      9. 4.12.9  TX Typical Characteristics at 800MHz
      10. 4.12.10 TX Typical Characteristics at 1.8GHz
      11. 4.12.11 TX Typical Characteristics at 2.6GHz
      12. 4.12.12 TX Typical Characteristics at 3.5GHz
      13. 4.12.13 TX Typical Characteristics at 4.9GHz
      14. 4.12.14 TX Typical Characteristics at 7.1GHz
      15. 4.12.15 PLL and Clock Typical Characteristics
  6. 5Device and Documentation Support
    1. 5.1 Receiving Notification of Documentation Updates
    2. 5.2 Support Resources
    3. 5.3 Trademarks
    4. 5.4 Electrostatic Discharge Caution
    5. 5.5 Glossary
  7. 6Revision History
  8. 7Mechanical, Packaging, and Orderable Information

TX Typical Characteristics at 800MHz

Typical values at TA = +25°C with nominal supplies. Unless otherwise noted, TX input data rate = 491.52MSPS, fDAC = 11796.48MSPS, interleave mode, AOUT = –1dBFS, 1st Nyquist zone output, Internal PLL, fREF = 491.52MSPS, 24x Interpolation, DSA = 0dB, Sin(x)/x enabled, DSA calibrated

AFE7903-SEP TX Full Scale vs RF
                        Frequency and Channel at 5898.24MSPS, Straight Mode
Including PCB and cable losses, Aout = -0.5dBFS, DSA = 0, 0.8GHz matching
Figure 4-293 TX Full Scale vs RF Frequency and Channel at 5898.24MSPS, Straight Mode
AFE7903-SEP TX Full Scale vs RF
                        Frequency and Channel at 5898.24MSPS, Interleave Mode
Including PCB and cable losses, Aout = -0.5dBFS, DSA = 0, 0.8GHz matching
Figure 4-295 TX Full Scale vs RF Frequency and Channel at 5898.24MSPS, Interleave Mode
AFE7903-SEP TX Full Scale vs RF
                        Frequency and Channel at 11796.48MSPS, Interleave Mode
Including PCB and cable losses, Aout = -0.5dBFS, DSA = 0, 0.8GHz matching
Figure 4-297 TX Full Scale vs RF Frequency and Channel at 11796.48MSPS, Interleave Mode
AFE7903-SEP TX Output Fullscale vs Temperature
including PCB and cable losses, Aout = -0.5dBFS, DSA = 0, 0.8GHz matching
Figure 4-299 TX Output Fullscale vs Temperature
AFE7903-SEP TX Uncalibrated
                        Differential Gain Error vs DSA Setting and Channel at 0.85GHz
fDAC = 5898.24MSPS, interleave mode, matching at 0.8GHz
Differential Gain Error = POUT(DSA Setting – 1) – POUT(DSA Setting) + 1
Figure 4-301 TX Uncalibrated Differential Gain Error vs DSA Setting and Channel at 0.85GHz
AFE7903-SEP TX Uncalibrated
                        Integrated Gain Error vs DSA Setting and Channel at 0.85GHz
fDAC = 5898.24MSPS, interleave mode, matching at 0.8GHz
Integrated Gain Error = POUT(DSA Setting ) – POUT(DSA Setting = 0) + DSA Settings
Figure 4-303 TX Uncalibrated Integrated Gain Error vs DSA Setting and Channel at 0.85GHz
AFE7903-SEP TX Uncalibrated
                        Differential Gain Error vs DSA Setting and Temperature at 0.85GHz
fDAC = 5898.24MSPS, interleave mode, matching at 0.8GHz
Differential Gain Error = POUT(DSA Setting – 1) – POUT(DSA Setting) + 1
Figure 4-305 TX Uncalibrated Differential Gain Error vs DSA Setting and Temperature at 0.85GHz
AFE7903-SEP TX Uncalibrated
                        Integrated Gain Error vs DSA Setting and Temperature at 0.85GHz
fDAC = 5898.24MSPS, interleave mode, matching at 0.8GHz
Integrated Gain Error = POUT(DSA Setting ) – POUT(DSA Setting = 0) + DSA Setting
Figure 4-307 TX Uncalibrated Integrated Gain Error vs DSA Setting and Temperature at 0.85GHz
AFE7903-SEP TX Uncalibrated
                        Differential Phase Error vs DSA Setting and Channel at 0.85GHz
fDAC = 5898.24MSPS, interleave mode, matching at 0.8GHz
Differential Phase Error = PhaseOUT(DSA Setting – 1) – PhaseOUT(DSA Setting)
Figure 4-309 TX Uncalibrated Differential Phase Error vs DSA Setting and Channel at 0.85GHz
AFE7903-SEP TX Uncalibrated
                        Integrated Phase Error vs DSA Setting and Channel at 0.85GHz
fDAC = 5898.24MSPS, interleave mode, matching at 0.8GHz
Integrated Phase Error = PhaseOUT(DSA Setting) – PhaseOUT(DSA Setting = 0)
Figure 4-311 TX Uncalibrated Integrated Phase Error vs DSA Setting and Channel at 0.85GHz
AFE7903-SEP TX Uncalibrated
                        Differential Phase Error vs DSA Setting and Temperature at 0.85GHz
fDAC = 5898.24MSPS, interleave mode, matching at 0.8GHz
Differential Phase Error = PhaseOUT(DSA Setting – 1) – PhaseOUT(DSA Setting) + 1
Figure 4-313 TX Uncalibrated Differential Phase Error vs DSA Setting and Temperature at 0.85GHz
AFE7903-SEP TX Uncalibrated
                        Integrated Phase Error vs DSA Setting and Temperature at 0.85GHz
fDAC = 5898.24MSPS, interleave mode, matching at 0.8GHz
Integrated Phase Error = PhaseOUT(DSA Setting) – PhaseOUT(DSA Setting = 0)
Figure 4-315 TX Uncalibrated Integrated Phase Error vs DSA Setting and Temperature at 0.85GHz
AFE7903-SEP TX Output Noise vs
                        Channel and Attenuation at 0.85GHz
fDAC = 5898.24MSPS, interleave mode, matching at 0.8GHz, POUT = –13dBFS
Figure 4-317 TX Output Noise vs Channel and Attenuation at 0.85GHz
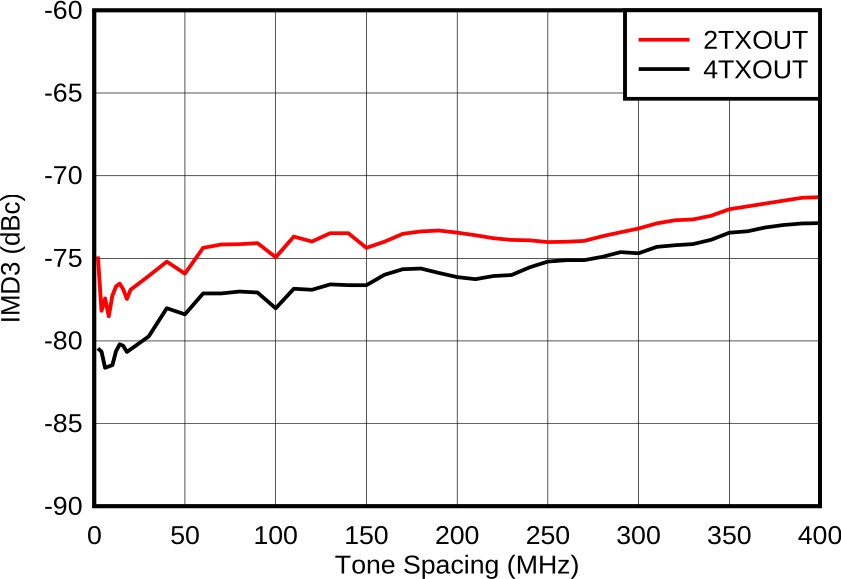
AFE7903-SEP TX IMD3 vs Tone Spacing
                        and Channel at 0.85GHz
fDAC = 5898.24MSPS, straight mode, fCENTER = 0.85GHz, matching at 0.8GHz, –13dBFS each tone
Figure 4-319 TX IMD3 vs Tone Spacing and Channel at 0.85GHz
AFE7903-SEP TX IMD3 vs Tone Spacing
                        and Channel at 0.85GHz
fDAC = 11796.48MSPS, interleave mode, fCENTER = 0.85GHz, matching at 0.8GHz, –13dBFS each tone
Figure 4-321 TX IMD3 vs Tone Spacing and Channel at 0.85GHz
AFE7903-SEP TX IMD3 vs Tone Spacing
                        and Temperature at 0.85GHz
fDAC = 8847.36MSPS, straight mode, fCENTER = 0.85GHz, matching at 0.8GHz, –13dBFS each tone, worst channel
Figure 4-323 TX IMD3 vs Tone Spacing and Temperature at 0.85GHz
AFE7903-SEP TX IMD3 vs Digital Level
                        at 0.85GHz
fDAC = 5898.24MSPS, straight mode, fCENTER = 0.85GHz, fSPACING = 20MHz, matching at 0.8GHz
Figure 4-325 TX IMD3 vs Digital Level at 0.85GHz
AFE7903-SEP TX IMD3 vs Digital Level
                        at 0.85GHz
fDAC = 11796.48MSPS, interleave mode, fCENTER = 0.85GHz, fSPACING = 20MHz, matching at 0.8GHz
Figure 4-327 TX IMD3 vs Digital Level at 0.85GHz
AFE7903-SEP TX 20MHz LTE Output
                        Spectrum at 0.85GHz
TM1.1, POUT_RMS = –13dBFS
Figure 4-329 TX 20MHz LTE Output Spectrum at 0.85GHz
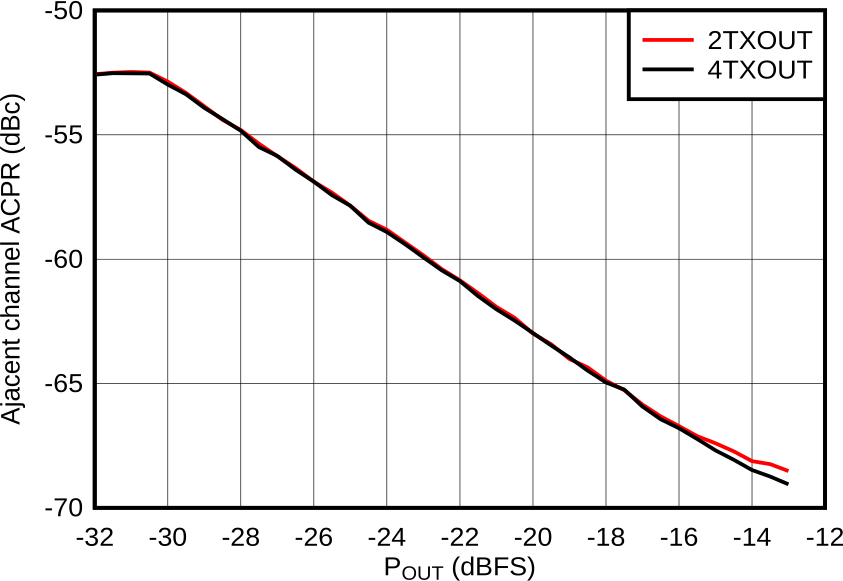
AFE7903-SEP TX 20MHz LTE alt-ACPR vs
                        Digital Level at 0.85GHz
Matching at 0.8GHz, single carrier 20MHz BW TM1.1 LTE
Figure 4-331 TX 20MHz LTE alt-ACPR vs Digital Level at 0.85GHz
AFE7903-SEP TX 20MHz LTE ACPR vs DSA
                        at 0.85GHz
Matching at 0.8GHz, single carrier 20MHz BW TM1.1 LTE
Figure 4-333 TX 20MHz LTE ACPR vs DSA at 0.85GHz
AFE7903-SEP TX 100MHz NR ACPR vs DSA
                        at 0.85GHz
Matching at 0.8GHz, single carrier 100MHz BW TM1.1 NR
Figure 4-335 TX 100MHz NR ACPR vs DSA at 0.85GHz
AFE7903-SEP TX HD2 vs Digital
                        Amplitude and Output Frequency at 0.85GHz
Matching at 0.8GHz, fDAC = 5898.24GSPS, straight mode
Figure 4-337 TX HD2 vs Digital Amplitude and Output Frequency at 0.85GHz
AFE7903-SEP TX HD3 vs Digital
                        Amplitude and Output Frequency at 0.85GHz
Matching at 0.8GHz, fDAC = 5898.24MSPS, straight mode, normalized to output power at harmonic frequency
Figure 4-339 TX HD3 vs Digital Amplitude and Output Frequency at 0.85GHz
AFE7903-SEP TX Single Tone (–12dBFS)
                        Output Spectrum at 0.85GHz (0-fDAC)
fDAC = 5898.24MSPS, interleave mode, 0.8GHz matching, includes PCB and cable losses. ILn = fS/n ± fOUT.
Figure 4-341 TX Single Tone (–12dBFS) Output Spectrum at 0.85GHz (0-fDAC)
AFE7903-SEP TX Single Tone (–6dBFS)
                        Output Spectrum at 0.85GHz (0-fDAC)
fDAC = 5898.24MSPS, interleave mode, 0.8GHz matching, includes PCB and cable losses. ILn = fS/n ± fOUT.
Figure 4-343 TX Single Tone (–6dBFS) Output Spectrum at 0.85GHz (0-fDAC)
AFE7903-SEP TX Single Tone (–1dBFS)
                        Output Spectrum at 0.85GHz (0-fDAC)
fDAC = 5898.24MSPS, interleave mode, 0.8GHz matching, includes PCB and cable losses. ILn = fS/n ± fOUT.
Figure 4-345 TX Single Tone (–1dBFS) Output Spectrum at 0.85GHz (0-fDAC)
AFE7903-SEP TX Single Tone (–12dBFS)
                        Output Spectrum at 0.85GHz (0-fDAC)
fDAC = 5898.24MSPS, straight mode, 0.8GHz matching, includes PCB and cable losses. ILn = fS/n ± fOUT and is due to mixing with digital clocks.
Figure 4-347 TX Single Tone (–12dBFS) Output Spectrum at 0.85GHz (0-fDAC)
AFE7903-SEP TX Single Tone (–6dBFS)
                        Output Spectrum at 0.85GHz (0-fDAC)
fDAC = 5898.24MSPS, straight mode, 0.8GHz matching, includes PCB and cable losses. ILn = fS/n ± fOUT and is due to mixing with digital clocks.
Figure 4-349 TX Single Tone (–6dBFS) Output Spectrum at 0.85GHz (0-fDAC)
AFE7903-SEP TX Single Tone (–1dBFS)
                        Output Spectrum at 0.85GHz (0-fDAC)
fDAC = 5898.24MSPS, straight mode, 0.8GHz matching, includes PCB and cable losses. ILn = fS/n ± fOUT and is due to mixing with digital clocks.
Figure 4-351 TX Single Tone (–1dBFS) Output Spectrum at 0.85GHz (0-fDAC)
AFE7903-SEP TX Full Scale vs RF
                        Frequency and Channel at 8847.36MSPS, Straight Mode
Including PCB and cable losses, Aout = -0.5dBFS, DSA = 0, 0.8GHz matching
Figure 4-294 TX Full Scale vs RF Frequency and Channel at 8847.36MSPS, Straight Mode
AFE7903-SEP TX Full Scale vs RF
                        Frequency and Channel at 8847.36MSPS, Interleave Mode
Including PCB and cable losses, Aout = -0.5dBFS, DSA = 0, 0.8GHz matching
Figure 4-296 TX Full Scale vs RF Frequency and Channel at 8847.36MSPS, Interleave Mode
AFE7903-SEP TX Output Fullscale vs Output Frequency
including PCB and cable losses, Aout = -0.5dBFS, DSA = 0, 0.8GHz matching
Figure 4-298 TX Output Fullscale vs Output Frequency
AFE7903-SEP TX Output Power vs DSA
                        Setting and Channel at 0.85GHz
fDAC = 11796.48MSPS, interleave mode, Aout = -0.5dBFS, matching 0.8GHz
Figure 4-300 TX Output Power vs DSA Setting and Channel at 0.85GHz
AFE7903-SEP TX Calibrated
                        Differential Gain Error vs DSA Setting and Channel at 0.85GHz
fDAC = 5898.24MSPS, interleave mode, matching at 0.8GHz
Differential Gain Error = POUT(DSA Setting – 1) – POUT(DSA Setting) + 1
Figure 4-302 TX Calibrated Differential Gain Error vs DSA Setting and Channel at 0.85GHz
AFE7903-SEP TX Calibrated Integrated
                        Gain Error vs DSA Setting and Channel at 0.85GHz
fDAC = 5898.24MSPS, interleave mode, matching at 0.8GHz
Integrated Gain Error = POUT(DSA Setting ) – POUT(DSA Setting = 0) + DSA Setting
Figure 4-304 TX Calibrated Integrated Gain Error vs DSA Setting and Channel at 0.85GHz
AFE7903-SEP TX Calibrated
                        Differential Gain Error vs DSA Setting and Temperature at 0.85GHz
fDAC = 5898.24MSPS, interleave mode, matching at 0.8GHz
Differential Gain Error = POUT(DSA Setting – 1) – POUT(DSA Setting) + 1
Figure 4-306 TX Calibrated Differential Gain Error vs DSA Setting and Temperature at 0.85GHz
AFE7903-SEP TX Calibrated Integrated
                        Gain Error vs DSA Setting and Temperature at 0.85GHz
fDAC = 5898.24MSPS, interleave mode, matching at 0.8GHz
Integrated Gain Error = POUT(DSA Setting ) – POUT(DSA Setting = 0) + DSA Setting
Figure 4-308 TX Calibrated Integrated Gain Error vs DSA Setting and Temperature at 0.85GHz
AFE7903-SEP TX Calibrated
                        Differential Phase Error vs DSA Setting and Channel at 0.85GHz
fDAC = 5898.24MSPS, interleave mode, matching at 0.8GHz
Differential Phase Error = PhaseOUT(DSA Setting – 1) – PhaseOUT(DSA Setting)
Phase DNL spike may occur at any DSA setting.
Figure 4-310 TX Calibrated Differential Phase Error vs DSA Setting and Channel at 0.85GHz
AFE7903-SEP TX Calibrated Integrated
                        Phase Error vs DSA Setting and Channel at 0.85GHz
fDAC = 5898.24MSPS, interleave mode, matching at 0.8GHz
Integrated Phase Error = PhaseOUT(DSA Setting) – PhaseOUT(DSA Setting = 0)
Figure 4-312 TX Calibrated Integrated Phase Error vs DSA Setting and Channel at 0.85GHz
AFE7903-SEP TX Calibrated
                        Differential Phase Error vs DSA Setting and Temperature at 0.85GHz
fDAC = 5898.24MSPS, interleave mode, matching at 0.8GHz, channel with the median variation over DSA setting at 25°C
Differential Phase Error = PhaseOUT(DSA Setting – 1) – PhaseOUT(DSA Setting) + 1
Figure 4-314 TX Calibrated Differential Phase Error vs DSA Setting and Temperature at 0.85GHz
AFE7903-SEP TX Calibrated Integrated
                        Phase Error vs DSA Setting and Temperature at 0.85GHz
fDAC = 5898.24MSPS, interleave mode, matching at 0.8GHz
Integrated Phase Error = PhaseOUT(DSA Setting) – PhaseOUT(DSA Setting = 0)
Figure 4-316 TX Calibrated Integrated Phase Error vs DSA Setting and Temperature at 0.85GHz
AFE7903-SEP TX IMD3 vs DSA Setting at
                        0.85GHz
fDAC = 11796.48MSPS, interleave mode, fCENTER = 0.85GHz, matching at 0.8GHz, –13dBFS each tone
Figure 4-318 TX IMD3 vs DSA Setting at 0.85GHz
AFE7903-SEP TX IMD3 vs Tone Spacing
                        and Channel at 0.85GHz
fDAC = 8847.36MSPS, straight mode, fCENTER = 0.85GHz, matching at 0.8GHz, –13dBFS each tone
Figure 4-320 TX IMD3 vs Tone Spacing and Channel at 0.85GHz
AFE7903-SEP TX IMD3 vs Tone Spacing
                        and Temperature at 0.85GHz
fDAC = 5898.24MSPS, straight mode, fCENTER =0.85GHz, matching at 0.8GHz, –13dBFS each tone, worst channel
Figure 4-322 TX IMD3 vs Tone Spacing and Temperature at 0.85GHz
AFE7903-SEP TX IMD3 vs Tone Spacing
                        and Temperature at 0.85GHz
fDAC = 11796.48MSPS, straight mode, fCENTER = 0.85GHz, matching at 0.8GHz, –13dBFS each tone, worst channel
Figure 4-324 TX IMD3 vs Tone Spacing and Temperature at 0.85GHz
AFE7903-SEP TX IMD3 vs Digital Level
                        at 0.85GHz
fDAC = 8847.36MSPS, straight mode, fCENTER = 0.85GHz, fSPACING = 20MHz, matching at 0.8GHz
Figure 4-326 TX IMD3 vs Digital Level at 0.85GHz
AFE7903-SEP TX Single Tone Output
                        Noise vs Frequency and Amplitude at 0.85GHz
Matching at 0.8GHz, Single tone, fDAC = 11.79648 GSPS, interleave mode, 40MHz offset, DSA = 0dB
Figure 4-328 TX Single Tone Output Noise vs Frequency and Amplitude at 0.85GHz
AFE7903-SEP TX 20MHz LTE ACPR vs
                        Digital Level at 0.85GHz
Matching at 0.8GHz, single carrier 20MHz BW TM1.1 LTE
Figure 4-330 TX 20MHz LTE ACPR vs Digital Level at 0.85GHz
AFE7903-SEP TX 20MHz LTE alt2-ACPR vs
                        Digital Level at 0.85GHz
Matching at 0.8GHz, single carrier 20MHz BW TM1.1 LTE
Figure 4-332 TX 20MHz LTE alt2-ACPR vs Digital Level at 0.85GHz
AFE7903-SEP TX 20MHz LTE alt-ACPR vs
                        DSA at 0.85GHz
Matching at 0.8GHz, single carrier 20MHz BW TM1.1 LTE
Figure 4-334 TX 20MHz LTE alt-ACPR vs DSA at 0.85GHz
AFE7903-SEP TX 100MHz NR alt-ACPR vs
                        DSA at 0.85GHz
Matching at 0.8GHz, single carrier 100MHz BW TM1.1 NR
Figure 4-336 TX 100MHz NR alt-ACPR vs DSA at 0.85GHz
AFE7903-SEP TX HD2 vs Digital
                        Amplitude and Output Frequency at 0.85GHz
Matching at 0.8GHz, fDAC = 8847.36GSPS, straight mode
Figure 4-338 TX HD2 vs Digital Amplitude and Output Frequency at 0.85GHz
AFE7903-SEP TX HD3 vs Digital
                        Amplitude and Output Frequency at 0.85GHz
Matching at 0.8GHz, fDAC = 8847.36MSPS, straight mode, normalized to output power at harmonic frequency
Figure 4-340 TX HD3 vs Digital Amplitude and Output Frequency at 0.85GHz
AFE7903-SEP TX Single Tone (–12dBFS)
                        Output Spectrum at 0.85GHz (±300MHz)
fDAC = 5898.24MSPS, interleave mode, 0.8GHz matching, includes PCB and cable losses
Figure 4-342 TX Single Tone (–12dBFS) Output Spectrum at 0.85GHz (±300MHz)
AFE7903-SEP TX Single Tone (–6dBFS)
                        Output Spectrum at 0.85GHz (±300MHz)
fDAC = 5898.24MSPS, interleave mode, 0.8GHz matching, includes PCB and cable losses
Figure 4-344 TX Single Tone (–6dBFS) Output Spectrum at 0.85GHz (±300MHz)
AFE7903-SEP TX Single Tone (–1dBFS)
                        Output Spectrum at 0.85GHz (±300MHz)
fDAC = 5898.24MSPS, interleave mode, 0.8GHz matching, includes PCB and cable losses
Figure 4-346 TX Single Tone (–1dBFS) Output Spectrum at 0.85GHz (±300MHz)
AFE7903-SEP TX Single Tone (–12dBFS)
                        Output Spectrum at 0.85GHz (±300MHz)
fDAC = 5898.24MSPS, straight mode, 0.8GHz matching, includes PCB and cable losses
Figure 4-348 TX Single Tone (–12dBFS) Output Spectrum at 0.85GHz (±300MHz)
AFE7903-SEP TX Single Tone (–6dBFS)
                        Output Spectrum at 0.85GHz (±300MHz)
fDAC = 5898.24MSPS, straight mode, 0.8GHz matching, includes PCB and cable losses
Figure 4-350 TX Single Tone (–6dBFS) Output Spectrum at 0.85GHz (±300MHz)
AFE7903-SEP TX Single Tone (–1dBFS)
                        Output Spectrum at 0.85GHz (±300MHz)
fDAC = 5898.24MSPS, straight mode, 0.8GHz matching, includes PCB and cable losses
Figure 4-352 TX Single Tone (–1dBFS) Output Spectrum at 0.85GHz (±300MHz)