SLAA843A August 2018 – March 2019 MSP430FR2512 , MSP430FR2512 , MSP430FR2522 , MSP430FR2522 , MSP430FR2532 , MSP430FR2532 , MSP430FR2533 , MSP430FR2533 , MSP430FR2632 , MSP430FR2632 , MSP430FR2633 , MSP430FR2633
3.4.2 Detection Margin (Mout)
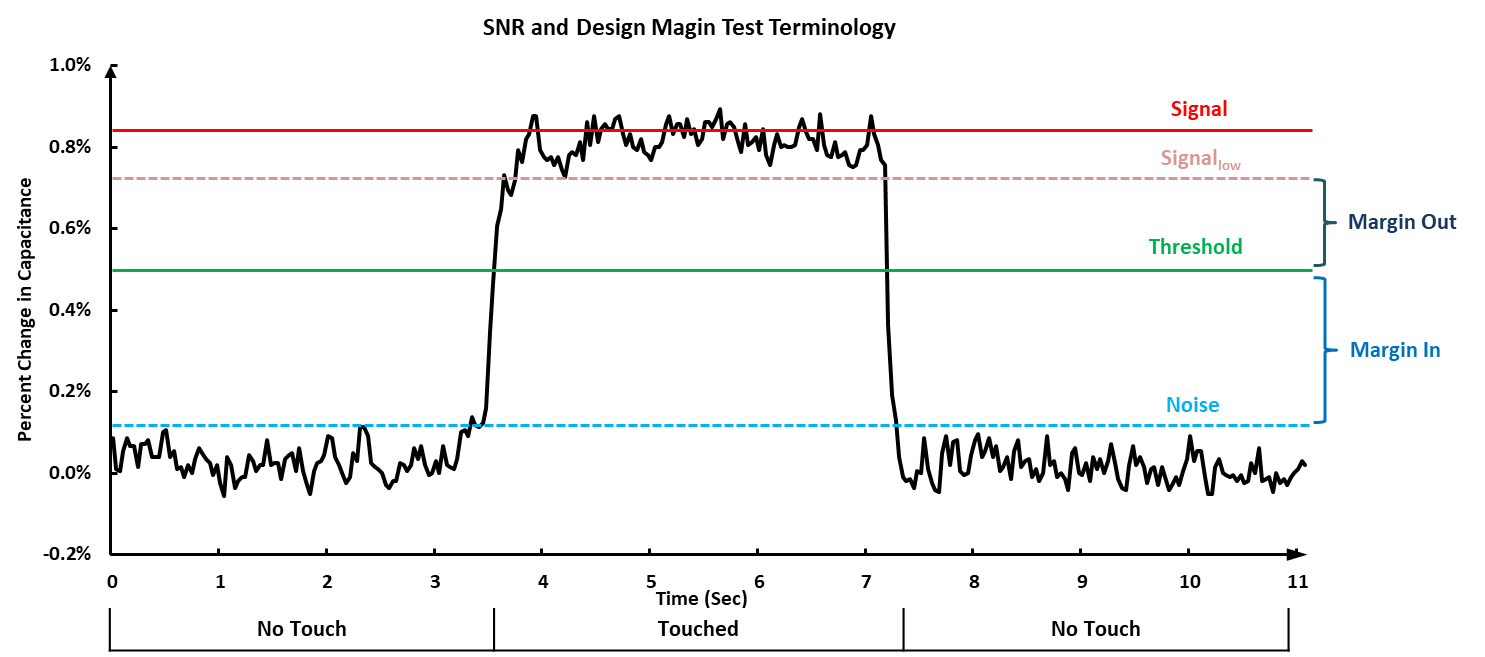
Detection margin is the opposite of false detection margin. Detection margin assumes a touched condition and is the difference between the lowest signal value Slow as showing in Figure 8 (perhaps due to noise that is present when a touch or proximity is applied) and the detection threshold (see Equation 4 and Equation 5 and Figure 8). This margin shows how stable the system is configured from getting out from the detection, in other words the system should have enough margin from the signal and the threshold so when a user touch is detected the noise will not push the signal out of detect.
Self Mode
Mutual Mode
For example, consider the case in which noise is present during a touch, the touch signal 'S' is not constant but has a minimum value of 1.3%, and the detection threshold is set to 1% just like the previous example. The Min in this case would be 1.3% – 1.0% = 0.3%. This parameter gives an idea of how stable the touch or proximity detection state is. If the detection threshold is set too high for a given signal, then the Min is reduced. If the detection threshold is reduced too much, it will be difficult to reliably detect touches without transitioning in and out of detection during a touch when additional noise is present on the signal.
Figure 8 shows the self mode button measurement result in terms of percent change in capacitance for both touched and untouched condition and the Margin In and the Margin Out are also defined as the percent change in capacitance as the blue area are showing in the figure.
