SLVAE32B August 2018 – December 2023 TPS7H2201-SP
- 1
- Abstract
- Trademarks
- 1 Device Overview
- 2 Single-Event Effects
- 3 Test Device and Evaluation Board Information
- 4 Depth, Range, and LETEFF Calculation
- 5 Irradiation Facility and Setup
- 6 Test Setup and Procedures
- 7 Single-Event-Latchup (SEL), Single-Event-Burnout (SEB), and Single-Event-Gate-Rupture (SEGR)
- 8 Single Event Transient (SET)
- 9 Total Ionizing Dose From SEE Experiments
- 10Orbital Environment Estimations
- 11Confidence Interval Calculations
- 12Summary
- 13References
- 14Revision History
10 Orbital Environment Estimations
To calculate on-orbit SEE event rates, both the device SEE cross-section and the flux of particles encountered in a particular orbit are required. Device SEE cross-sections are usually determined experimentally while flux of particles in orbit is calculated using various codes. For the purpose of generating some event rates, a Low-Earth Orbit (LEO) and a Geostationary-Earth Orbit (GEO) were calculated using CREME96. CREME96 code, short for Cosmic Ray Effects on Micro-Electronics, is a suite of programs (10, 11) that enable estimation of the radiation environment in near-Earth orbits. CREME96 is one of several tools available in the aerospace industry to provide accurate space environment calculations. Over the years since its introduction, the CREME models have been compared with on-orbit data and demonstrated their accuracy. In particular, CREME96 incorporates realistic worst-case solar particle event models, where fluxes can increase by several orders-of-magnitude over short periods of time.
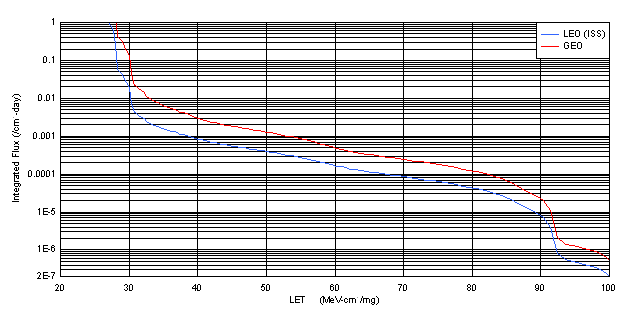
For the purposes of generating conservative event rates, the worst-week model (based on the biggest solar event lasting a week in the last 45 years) was selected, which has been equated to a 99%-confidence level worst-case event (12, 13). The integrated flux includes protons to heavy ions from solar and galactic sources. A minimal shielding configuration is assumed at 100 mils (2.54 mm) of aluminum. Two orbital environments were estimated, that of the International Space Station (ISS) which is LEO and the GEO environment. Figure 10-1 shows the integrated flux (from high LET to low) for these two environments.
 Figure 10-1 Integral Particle Flux Versus
LETEFF for a LEO-ISS (blue curve) and a GEO (red curve) Environment as
Calculated by CREME96 Assuming Worst-week and 100 mils (2.54 mm) of Aluminum
Shielding
Figure 10-1 Integral Particle Flux Versus
LETEFF for a LEO-ISS (blue curve) and a GEO (red curve) Environment as
Calculated by CREME96 Assuming Worst-week and 100 mils (2.54 mm) of Aluminum
ShieldingNote that the y-axis represents flux integrated from higher LET to lower LET. The value of integral flux at any specific LET value is actually the integral of all ion events at that specific LET value to all higher LETs.
Figure 10-1 shows the Integral Particle Flux versus LETEFF for a LEO-ISS (blue curve) and a GEO (red curve) environment as calculated by CREME96 assuming worst-week and 100 mils (2.54 mm) of aluminum shielding. Note that the y-axis represents flux integrated from higher LET to lower LET. The value of integral flux at any specific LET value is actually the integral of all ion events at that specific LET value to all higher LETs.
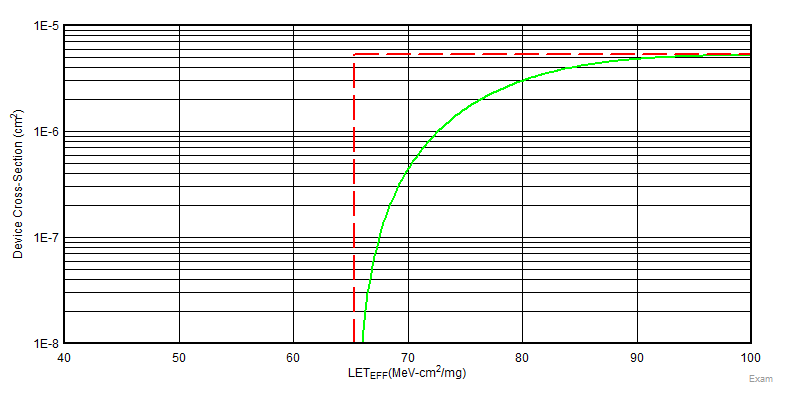
Using this data, a user can extract integral particle fluxes for any arbitrary LET of interest. To simplify the calculation of event rates, assume that all cross-section curves are square, meaning that below the onset LET, the cross-section is identically zero while above the onset LET, the cross-section is uniformly equal to the saturation cross-section. Figure 10-2 shows the approximation, with the green curve as the actual Weibull fit to the data with the square approximation shown as the red-dashed line. This allows the user to calculate event rates with a single multiplication, the event rate becoming the product of the integral flux at the onset LET, and the saturation cross-section. Obviously this leads to an over-estimation of the event rate since the area under the square approximation is larger than the actual cross-section curve – but for the purposes of calculating upper-bound event rate estimates, this modification avoids the requirement of the integral over the flux and cross-section curves.
 Figure 10-2 Device Cross-section Versus
LETEFF Showing How the Weibull Fit (Green) is Simplified with the
Use a Square Approximation (Red Dashed Line)
Figure 10-2 Device Cross-section Versus
LETEFF Showing How the Weibull Fit (Green) is Simplified with the
Use a Square Approximation (Red Dashed Line)Figure 10-2 shows a device cross-section versus LETEFF, showing how the Weibull fit (green) is simplified with the use of a square approximation (red dashed line).
To demonstrate how the event rates in this report were calculated, assume that the user must calculate an event rate for a GEO orbit for the device whose cross-section is shown in Figure 10-2. Using the red curve in Figure 10-1 and the onset LET value obtained from Figure 10-2 (approximately 65 MeV-cm2 / mg), the GEO integral flux is approximately 3.24 × 10⁻⁴ ions / cm2-day. The event rate is the product of the integral flux and the saturation cross-section in Figure 10-2 (approximately 5.3 × 10⁻⁶ cm2):


