SLVSGL6B July   2022  – October 2026 TPS1HC30-Q1

PRODUCTION DATA  

  1.   1
  2. 1 Features
  3. 2 Applications
  4. 3 Description
  5. 4 Pin Configuration and Functions
  6. 5 Specifications
    1. 5.1 Absolute Maximum Ratings
    2. 5.2 ESD Ratings
    3. 5.3 Recommended Operating Conditions
    4. 5.4 Thermal Information
    5. 5.5 Electrical Characteristics
    6. 5.6 SNS Timing Characteristics
    7. 5.7 Switching Characteristics
    8. 5.8 Typical Characteristics
  7. 6 Parameter Measurement Information
  8. 7 Detailed Description
    1. 7.1 Overview
    2. 7.2 Functional Block Diagram
    3. 7.3 Feature Description
      1. 7.3.1 Accurate Current Sense
      2. 7.3.2 Programmable Current Limit
        1. 7.3.2.1 Current Limit Accuracy Across VDS
        2. 7.3.2.2 Capacitive Charging
      3. 7.3.3 Inductive-Load Switching-Off Clamp
      4. 7.3.4 Full Protections and Diagnostics
        1. 7.3.4.1  Short-Circuit and Overload Protection
        2. 7.3.4.2  Open-Load and Short-to-Battery Detection
        3. 7.3.4.3  Short-to-Battery Detection
        4. 7.3.4.4  Reverse-Polarity and Battery Protection
        5. 7.3.4.5  Latch-Off Mode
        6. 7.3.4.6  Thermal Protection Behavior
        7. 7.3.4.7  UVLO Protection
        8. 7.3.4.8  Loss of GND Protection
        9. 7.3.4.9  Loss of Power Supply Protection
        10. 7.3.4.10 Reverse Current Protection
        11. 7.3.4.11 Protection for MCU I/Os
      5. 7.3.5 Diagnostic Enable Function
    4. 7.4 Device Functional Modes
      1. 7.4.1 Working Mode
  9. 8 Application and Implementation
    1. 8.1 Application Information
    2. 8.2 Typical Application
      1. 8.2.1 Design Requirements
      2. 8.2.2 Detailed Design Procedure
        1. 8.2.2.1 Dynamically Changing Current Limit
        2. 8.2.2.2 EMC Transient Disturbances Test
    3. 8.3 Power Supply Recommendations
    4. 8.4 Layout
      1. 8.4.1 Layout Guidelines
      2. 8.4.2 Layout Example
        1. 8.4.2.1 Without a GND Network
        2. 8.4.2.2 With a GND Network
      3. 8.4.3 Thermal Considerations
  10. 9 Device and Documentation Support
    1. 9.1 Documentation Support
      1. 9.1.1 Related Documentation
    2. 9.2 Receiving Notification of Documentation Updates
    3. 9.3 Support Resources
    4. 9.4 Trademarks
    5. 9.5 Electrostatic Discharge Caution
    6. 9.6 Glossary
  11. 10Revision History
  12. 11Mechanical, Packaging, and Orderable Information

Typical Characteristics

All the following data are based on the mean value of the three lots samples, VVBB = 13.5V if not specified.

TPS1HC30-Q1 Transient Thermal Impedance
 
Figure 5-1 Transient Thermal Impedance
TPS1HC30-Q1 Output Leakage Current IOUT,STBY vs Temperature
VOUT = 0VVEN = 0VVDIAG_EN = 0V
VBB Varied
Figure 5-3 Output Leakage Current IOUT,STBY vs Temperature
TPS1HC30-Q1 Diagnostic Current IDIA vs Temperature
IOUT = 0AVEN = 0VVDIAG_EN = 5V
VBB Varied
Figure 5-5 Diagnostic Current IDIA vs Temperature
TPS1HC30-Q1 RDSON vs VBB
IOUT = 1AVEN = 5VVDIAG_EN = 5V
VBB Varied
Figure 5-7 RDSON vs VBB
TPS1HC30-Q1 KCL vs RILIM
ROUT = 5μH and 100mΩVEN = 5VVDIAG_EN = 5V
VDS = 3V
Figure 5-9 KCL vs RILIM
TPS1HC30-Q1 KSNS Error vs VBB
IOUT = 1.5A VEN = 5VVDIAG_EN = 5V
VBB variedRSNS = 1kΩ
Figure 5-11 KSNS Error vs VBB
TPS1HC30-Q1 VSNSFH (5V) vs VBB
ROUT = 5μH and 100mΩ VEN = 5VVDIAG_EN = 5V
VBB variedRSNS = 1kΩ
Figure 5-13 VSNSFH (5V) vs VBB
TPS1HC30-Q1 Turn-Off Time
                            TOFF vs Temperature
ROUT = 10Ω VEN = 5VVDIAG_EN = 5V
VBB variedRSNS = 1kΩ
Figure 5-15 Turn-Off Time TOFF vs Temperature
TPS1HC30-Q1 Falling Slew Rate SRF vs Temperature
ROUT = 10Ω VEN = 5VVDIAG_EN = 5V
VBB variedRSNS = 1kΩ
Figure 5-17 Falling Slew Rate SRF vs Temperature
TPS1HC30-Q1 VIL vs Temperature
ROUT = 1kΩ VEN = 3.3 to 0VVDIAG_EN = 3.3 to 0V
VBB variedRSNS = 1kΩ
Figure 5-19 VIL vs Temperature
TPS1HC30-Q1 Turn-Off Time
                            (tOFF)
ROUT = 10Ω VEN = 5 to 0VVDIAG_EN = 0V
VBB = 13.5VRSNS = 1kΩ
Figure 5-21 Turn-Off Time (tOFF)
TPS1HC30-Q1 Short Circuit With ILIM Shorted to Ground
ROUT = 5μH and 100mΩ VEN = 5VVDIAG_EN = 5V
VBB = 13.5VRSNS = 1kΩRILIM = 7.15kΩ
Figure 5-23 Short Circuit With ILIM Shorted to Ground
TPS1HC30-Q1 470μF Capacitive Load Driving
ROUT = 470μF and 20Ω VEN = 5VVDIAG_EN = 5V
VBB = 13.5VRSNS = 1kΩRILIM = 71.5kΩ
Figure 5-25 470μF Capacitive Load Driving
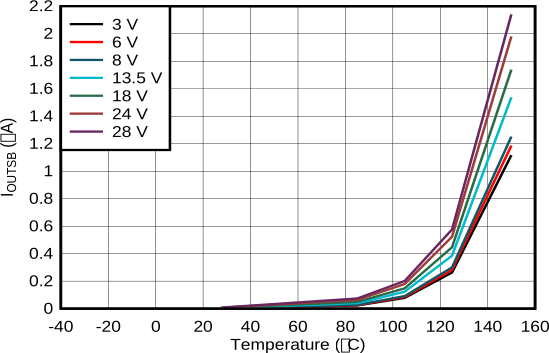
TPS1HC30-Q1 Standby Current
                            ISB vs Temperature
VOUT = 0VVEN = 0VVDIAG_EN = 0V
VBB Varied
Figure 5-2 Standby Current ISB vs Temperature
TPS1HC30-Q1 Quiescent Current IQ vs Temperature
IOUT = 0AVEN = 5VVDIAG_EN = 5V
VBB Varied
Figure 5-4 Quiescent Current IQ vs Temperature
TPS1HC30-Q1 RDSON vs Temperature
IOUT = 1AVEN = 5VVDIAG_EN = 5V
VBB Varied
Figure 5-6 RDSON vs Temperature
TPS1HC30-Q1 RONREV vs Temperature
IOUT = 1AVEN = 5VVDIAG_EN = 5V
VBB Varied
Figure 5-8 RONREV vs Temperature
TPS1HC30-Q1 KSNS Error vs Load Current
ROUT varied VEN = 5VVDIAG_EN = 5V
VBB = 13.5VRSNS = 1kΩ
Figure 5-10 KSNS Error vs Load Current
TPS1HC30-Q1 VSNSFH (3.3V) vs VBB
ROUT = 5μH and 100mΩ VEN = 5VVDIAG_EN = 3.3V
VBB variedRSNS = 1kΩ
Figure 5-12 VSNSFH (3.3V) vs VBB
TPS1HC30-Q1 Turn-On Time
                            TON vs Temperature
ROUT = 10Ω VEN = 5VVDIAG_EN = 5V
VBB variedRSNS = 1kΩ
Figure 5-14 Turn-On Time TON vs Temperature
TPS1HC30-Q1 Rising Slew Rate SRR vs Temperature
ROUT = 10Ω VEN = 5VVDIAG_EN = 5V
VBB variedRSNS = 1kΩ
Figure 5-16 Rising Slew Rate SRR vs Temperature
TPS1HC30-Q1 VIH vs Temperature
ROUT = 1kΩ VEN = 0 to 3.3VVDIAG_EN = 0 to 3.3V
VBB variedRSNS = 1kΩ
Figure 5-18 VIH vs Temperature
TPS1HC30-Q1 Turn-On Time
                            (tON)
ROUT = 10Ω VEN = 0 to 5VVDIAG_EN = 0V
VBB = 13.5VRSNS = 1kΩ
Figure 5-20 Turn-On Time (tON)
TPS1HC30-Q1 ISNS Settling Time (tSNSION) on Load Step
IOUT = 1A to 5A VEN = 5VVDIAG_EN = 5V
VBB = 13.5VRSNS = 1kΩ
Figure 5-22 ISNS Settling Time (tSNSION) on Load Step
TPS1HC30-Q1 5-mH Inductive Load
                        Driving
ROUT = 5mH VEN = 5VVDIAG_EN = 5V
VBB = 13.5VRSNS = 1kΩRILIM = GND
Figure 5-24 5-mH Inductive Load Driving