TIDT238 July   2021 TL7700-SEP


  1. 1Description
  2. 2Test Prerequisites
    1. 2.1 Voltage and Current Requirements
    2. 2.2 Considerations
    3. 2.3 Dimensions
  3. 3Testing and Results
    1. 3.1 Efficiency Graphs
    2. 3.2 Efficiency Data
    3. 3.3 Thermal Images
    4. 3.4 EMI
  4. 4Waveforms
    1. 4.1 Switching
    2. 4.2 Output Voltage Ripple
    3. 4.3 Load Transients
    4. 4.4 Start-up Sequence

Thermal Images

Thermal images were taken after 15 minutes of running with no airflow, at an ambient temperature of 24°C.

All components are on the top of the board so it is the only view shown in the thermal images.
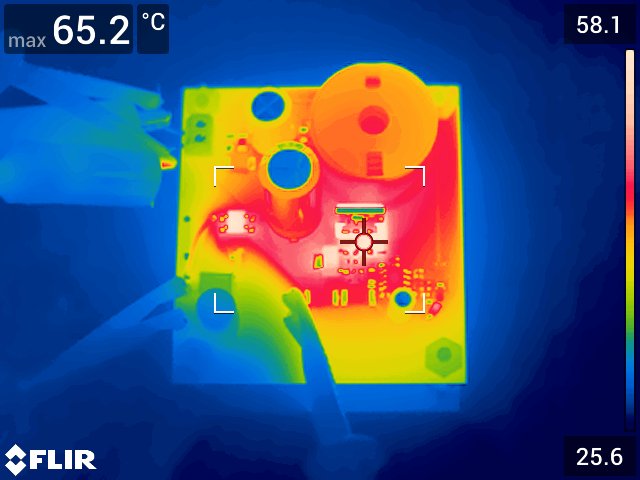
GUID-20210427-CA0I-JD94-WN6M-TTTNHHQPJBDM-low.pngFigure 3-2 Thermal Image