TIDT238 July   2021 TL7700-SEP


  1. 1Description
  2. 2Test Prerequisites
    1. 2.1 Voltage and Current Requirements
    2. 2.2 Considerations
    3. 2.3 Dimensions
  3. 3Testing and Results
    1. 3.1 Efficiency Graphs
    2. 3.2 Efficiency Data
    3. 3.3 Thermal Images
    4. 3.4 EMI
  4. 4Waveforms
    1. 4.1 Switching
    2. 4.2 Output Voltage Ripple
    3. 4.3 Load Transients
    4. 4.4 Start-up Sequence

EMI

Conducted emissions measurements were taken using both quasi-peak and average detector methods (yellow and green traces, respectively). The measurements are compared to the CISPR-25 Class B regulations for quasi-peak and average tests. For this test a resistive load was used to apply a 24-W load to the output.
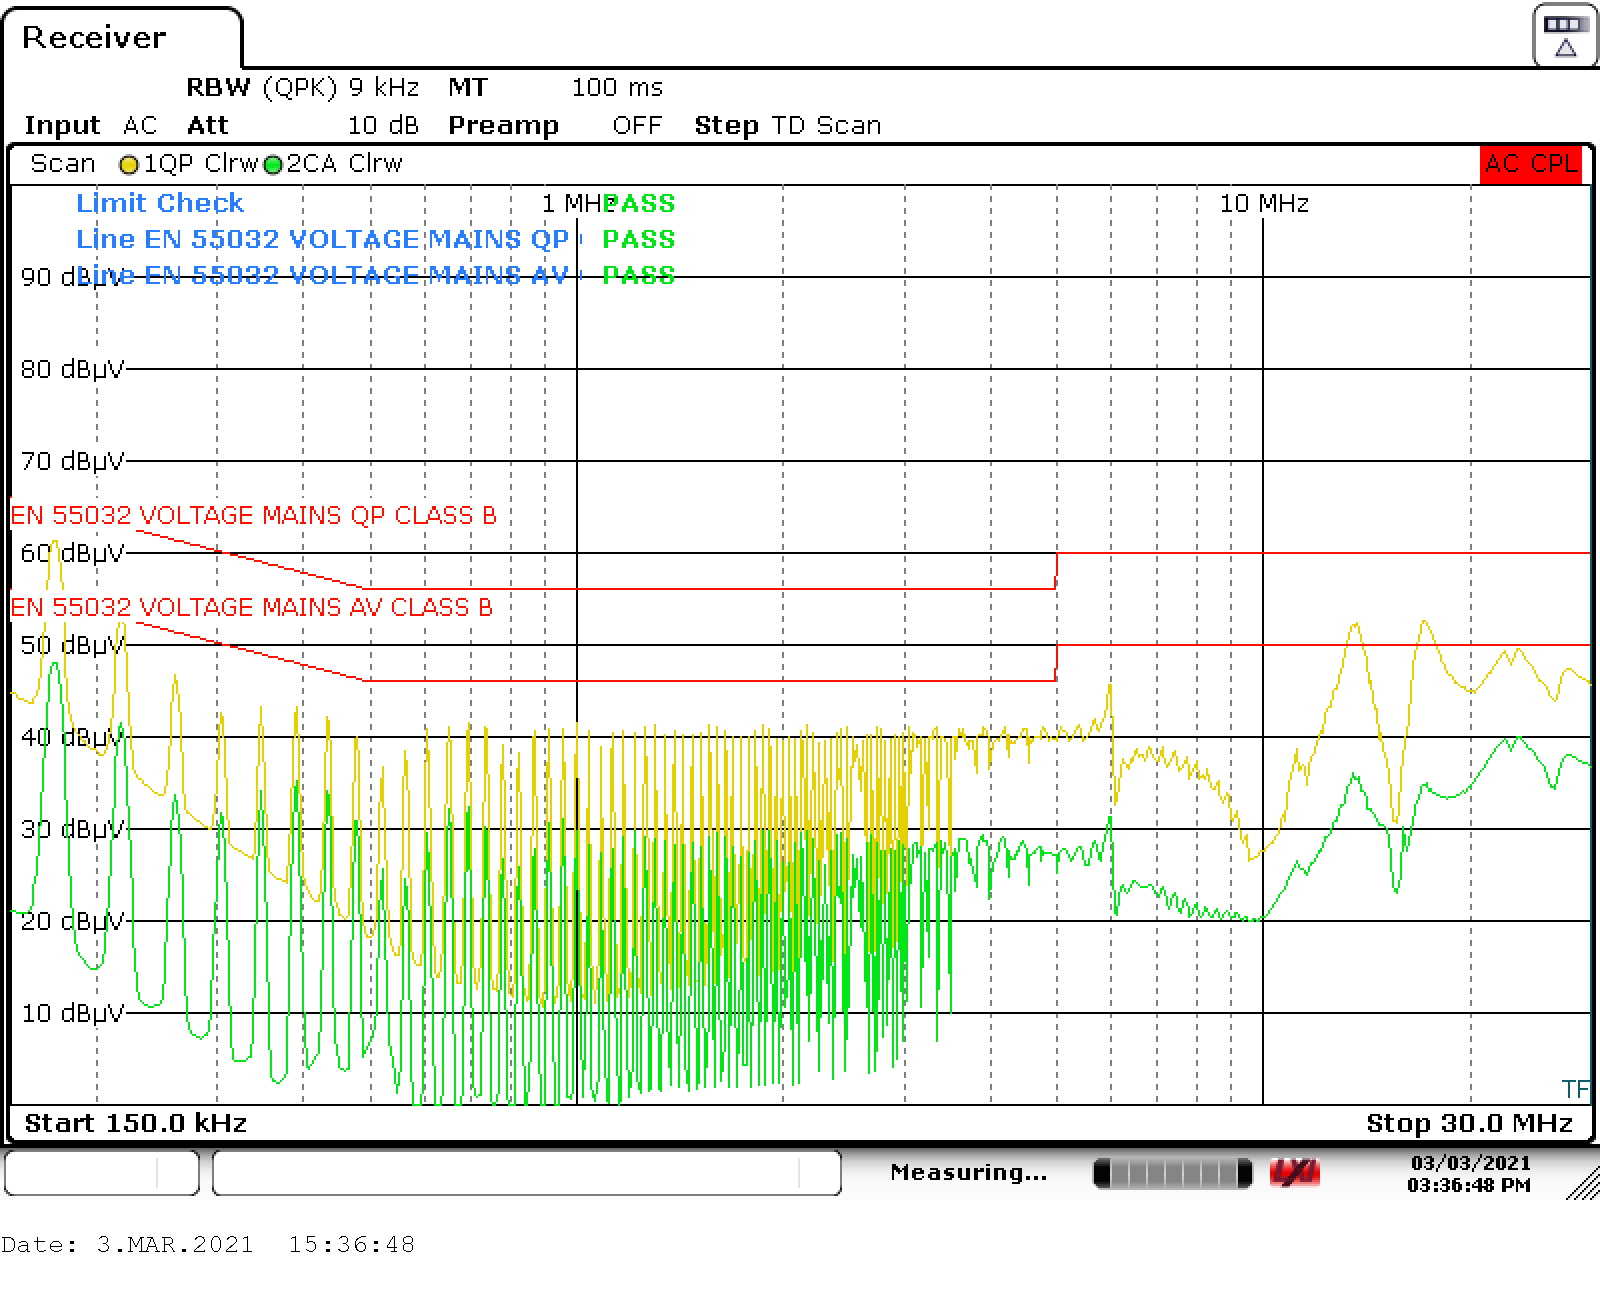
GUID-20210427-CA0I-ZWCV-ZPGC-TTTT3XTPCX0M-low.pngFigure 3-3 EMI