TIDT367 December 2023
- 1
- Description
- Features
- Applications
-
1Test Prerequisites
- 1.1 Voltage and Current Requirements
- 1.2 Required Equipment
- 1.3 Test Setup
- 1.4
Running the Code for Different Labs
- 1.4.1 Lab 1. Primary to Secondary Power Flow, Open Loop Check PWM Driver
- 1.4.2 Lab 2. Primary to Secondary Power Flow, Open Loop CheckPWM Driver and ADC With Protection
- 1.4.3 Lab 3. Primary to Secondary Power Flow, Closed Voltage Loop Check
- 1.4.4 Lab 4. Primary to Secondary Power Flow, Closed Current Loop Check
- 1.4.5 Lab 6. Secondary to Primary Power Flow, Open Loop Check PWM Driver
- 1.4.6 Lab 7. Secondary to Primary Power Flow, Open Loop Check PWM Driver and ADC With Protection
- 1.4.7 Lab 8. Secondary to Primary Power Flow, Closed Voltage Loop Check
- 2Testing and Results
- 3Waveforms
2.1 Efficiency Graphs
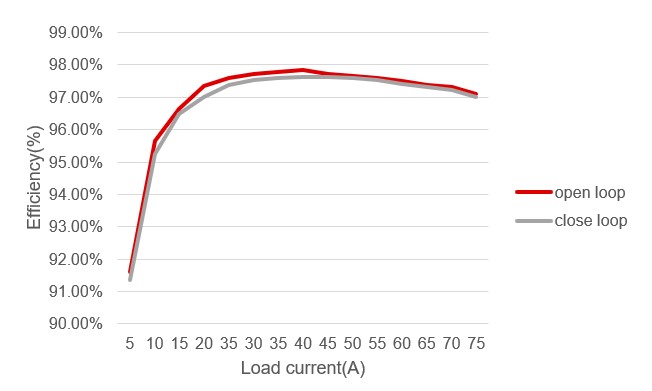
Efficiency is shown in the following figure. The data was created in charging mode under different load conditions.
 Figure 2-1 Efficiency Graph in Charging
Mode
Figure 2-1 Efficiency Graph in Charging
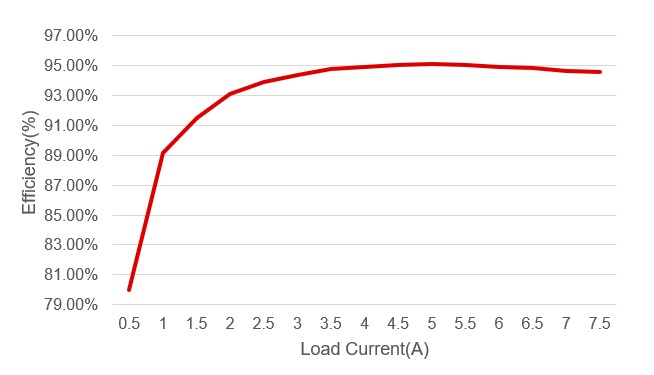
ModeFigure 2-2 shows open loop efficiency in discharging mode under different load conditions.
 Figure 2-2 Efficiency Graph in Discharging Mode