TIDUCL3 February 2017
- 1 Overview
- 2 Resources
- 3 Features
- 4 Applications
- 5 Design Images
- 6 System Overview
-
7 System Design Theory
- 7.1 PCB and Form Factor
- 7.2 Optimizing Board Performance Based on LED String Voltage and Current
- 7.3 Switching Frequency
- 7.4 Output Overvoltage Protection (OVP)
- 7.5 Current Monitoring (IMON)
- 7.6 Thermal Foldback
- 7.7 Clock Generation (PWM)
- 7.8 Onboard Supply and Setting Duty Cycle
- 7.9 Buffering, Averaging, and Filtering
- 7.10 Boost Converter
- 8 Getting Started Hardware
- 9 Testing and Results
- 10Design Files
- 11Related Documentation
- 12About the Author
9.2 Thermal Foldback Testing
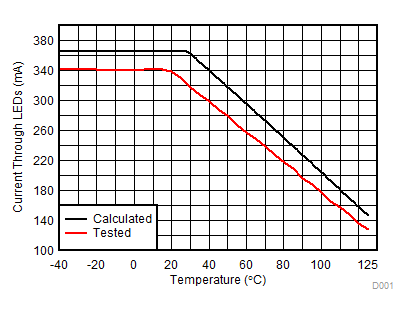
The benefit of this TI Design is how linearly and accurately the current through the LEDs follows the temperature as shown in Figure 25.
 Figure 25. Thermal Foldback Tested
 Note that the calculated data is based on the clamp of the IADJ pin set to 2.25 V. This can vary as per the datasheet; however, the slopes of the line when they are decreasing are different by 0.225 and the linearity of the slop is 0.9998. As discussed in Section 7.6, the slope, starting point, and bottom clamp of this graph can all be manipulated in order to create the desired foldback response.