SBAU362 March 2021 ADS1015 , ADS1115
5.2.2 Chart
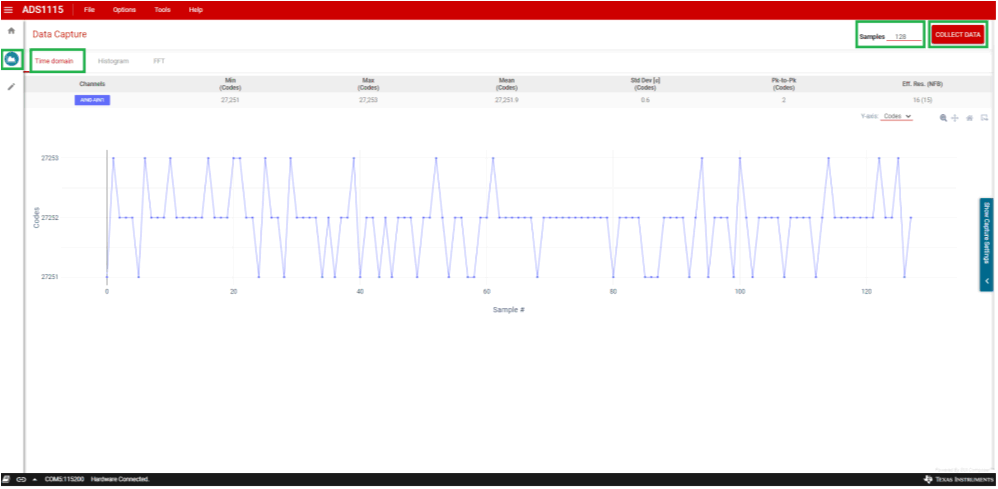
The Chart icon selects the available charting options for displaying conversion data. The data options include a Time Domain, Histogram, and FFT displays.
The Chart tab allows configuration of the Data Capture for the ADS1x15. At the upper right of the capture window (as illustrated in Figure 5-14) is the setting for the number of Samples to collect. To capture data, press the Collect Data button displayed at the upper corner of the window.
 Figure 5-14 Data Capture Window
Conversion data collects when the Collect Data button is pressed. The button will then change to Stop Collect and, by pressing this button, the collection of conversion data will stop. If this button is not pressed, data are collected for the number of Samples given. The number of Samples can be changed prior to pressing Collect Data by selecting the Samples and directly entering the desired number of samples or by clicking on the up and down arrows. The number of samples cannot be changed while data are being collected.
When the Collect Data operation is complete, the data will display with the calculated channel statistics and a plot of the data in the chart window. Various icons for viewing the data include zoom, pan, and home. The home icon restores the graph to show all data collected. The viewing icons are underneath the statistics information on the right side of the GUI.
Also on the right side of the chart window is a slide-out menu where configuration settings are displayed and changes can be made for data collection.