SBOU180B november   2016  – july 2023 INA260


  1.   1
  2.   INA260EVM-PDK and Software Tutorial
  3.   Trademarks
  4. 1Overview
    1. 1.1 INA260EVM-PDK Contents
    2. 1.2 INA260EVM-PDK Features
    3. 1.3 Related Documentation from Texas Instruments
  5. 2INA260EVM-PDK Hardware
    1. 2.1 SM-USB-DIG Platform Description
    2. 2.2 INA260EVM PCB Description
      1. 2.2.1 EVM Power Supply
      2. 2.2.2 EVM Analog Inputs
    3. 2.3 EVM Digital Inputs and Outputs
  6. 3INA260EVM-PDK (Rev A) Setup
    1. 3.1 One-Time GUI Software Installation
    2. 3.2 INA260EVM Jumper Settings
    3. 3.3 Connecting the Hardware
    4. 3.4 System Power-Up
  7. 4INA260EVM GUI Software
    1. 4.1 Configuration Tool
      1. 4.1.1 Step 1: Set the I2C Address
      2. 4.1.2 Step 2: Configure Operation
      3. 4.1.3 Step 3: Set Conversion Times
      4. 4.1.4 Step 4: Configure Alert
    2. 4.2 Results Bar
    3. 4.3 Graph Tool
    4. 4.4 Registers Tool
  8. 5INA260EVM Documentation
    1. 5.1 Schematic
    2. 5.2 PCB Layout
    3. 5.3 Bill of Materials
  9. 6Revision History

Graph Tool

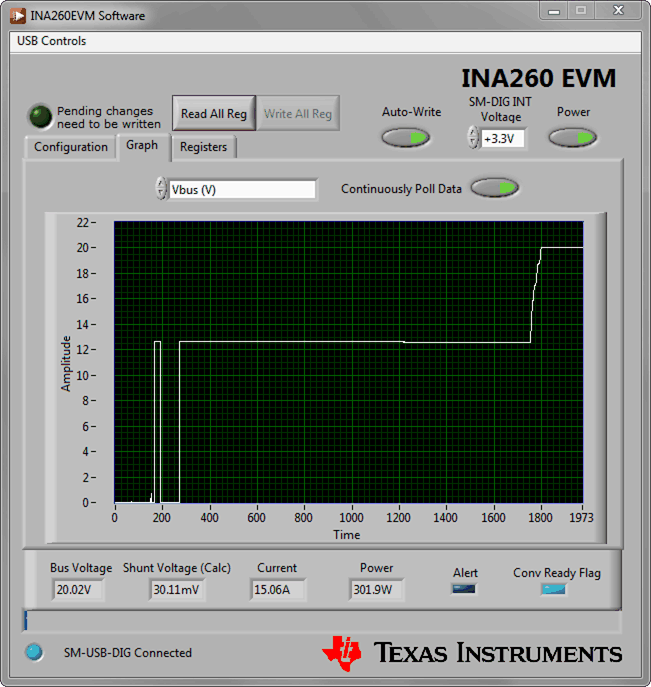
The Graph tool buffers and plots measurement data over time, similar to an oscilloscope, as shown in Figure 4-7. The Y-axis variable can be changed from the drop-down menu. Users can either click the Read All Reg button to update the plot or enable the Continuously Poll Data button to read the output registers continuously. Note that the output registers do not update until a new set of samples are acquired. To acquire new samples, click the Write All Reg button or configure the INA260 for continuous trigger mode.

Note:

The recommended operating mode for using the Graph tool is Shunt and Bus, Continuous.
GUID-5C50724E-06CA-469A-90E0-C0CB478D2C9C-low.gifFigure 4-7 Graph Tool Page