SLVAE30E February   2021  – March 2021 TPS1H000-Q1 , TPS1H100-Q1 , TPS1H200A-Q1 , TPS1HA08-Q1 , TPS25200-Q1 , TPS27S100 , TPS2H000-Q1 , TPS2H160-Q1 , TPS2HB16-Q1 , TPS2HB35-Q1 , TPS2HB50-Q1 , TPS4H000-Q1 , TPS4H160-Q1


  1.   Trademarks
  2. 1Introduction
  3. 2Driving Resistive Loads
    1. 2.1 Background
    2. 2.2 Application Example
    3. 2.3 Why Use a Smart High Side Switch?
      1. 2.3.1 Accurate Current Sensing
      2. 2.3.2 Adjustable Current Limiting
    4. 2.4 Selecting the Right Smart High Side Switch
      1. 2.4.1 Power Dissipation Calculation
      2. 2.4.2 PWM and Switching Loss
  4. 3Driving Capacitive Loads
    1. 3.1 Background
    2. 3.2 Application Examples
    3. 3.3 Why Use a Smart High Side Switch?
      1. 3.3.1 Capacitive Load Charging
      2. 3.3.2 Inrush Current Mitigation
        1. 3.3.2.1 Capacitor Charging Time
      3. 3.3.3 Thermal Dissipation
      4. 3.3.4 Junction Temperature During Capacitive Inrush
      5. 3.3.5 Over Temperature Shutdown
      6. 3.3.6 Selecting the Correct Smart High Side Switch
  5. 4Driving Inductive Loads
    1. 4.1 Background
    2. 4.2 Application Examples
    3. 4.3 Why Use a Smart High Side Switch?
    4. 4.4 Turn-On Phase
    5. 4.5 Turn-Off Phase
      1. 4.5.1 Demagnetization Time
      2. 4.5.2 Instantaneous Power Losses During Demagnetization
      3. 4.5.3 Total Energy Dissipated During Demagnetization
      4. 4.5.4 Measurement Accuracy
      5. 4.5.5 Application Example
      6. 4.5.6 Calculations
      7. 4.5.7 Measurements
    6. 4.6 Selecting the Correct Smart High Side Switch
  6. 5Driving LED Loads
    1. 5.1 Background
    2. 5.2 Application Examples
    3. 5.3 LED Direct Drive
    4. 5.4 LED Modules
    5. 5.5 Why Use a Smart High Side Switch?
    6. 5.6 Open Load Detection
    7. 5.7 Load Current Sensing
    8. 5.8 Constant Current Source
      1. 5.8.1 Selecting the Correct Smart High Side Switch
  7. 6Appendix
    1. 6.1 Transient Thermal Impedance Data
    2. 6.2 Demagnitization Energy Capability Data
  8. 7References
  9. 8Revision History

Capacitor Charging Time

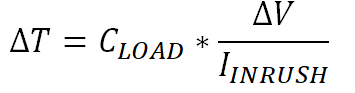
Looking back at the equation for capacitor charging allows us to predict the charging profile during inrush current limiting. Rearranging Equation 16 to calculate the charging time gives us Equation 17.

Equation 17. GUID-20200811-CA0I-L1GM-RQPD-32CNFL5J3VKS-low.png

Equation Equation 18 shows us that Equation 17 is accurate for Figure 3-9.

Equation 18. GUID-20200811-CA0I-PHPS-ZNQS-PW1T1XZMXFFF-low.png

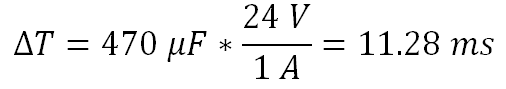
Equation 17 shows that the lower the magnitude of the current limit set-point the longer it will take to charge the load capacitance. It is important to adjust this current limit set-point such that it appropriately balances between safely limiting current without significantly extending the charging time. This balance must be determined by looking at the specific application requirements such as system startup timing.