DLPA083B june 2019 – april 2023 DLP2000 , DLP2010 , DLP230KP , DLP230NP , DLP3010 , DLP3030-Q1 , DLP3310 , DLP4620S-Q1 , DLP470NE , DLP470TE , DLP4710 , DLP471NE , DLP471TE , DLP471TP , DLP480RE , DLP500YX , DLP5500 , DLP550HE , DLP550JE , DLP5530-Q1 , DLP5530S-Q1 , DLP5531-Q1 , DLP5533A-Q1 , DLP6500FLQ , DLP6500FYE , DLP650LE , DLP650LNIR , DLP650NE , DLP650TE , DLP651NE , DLP660TE , DLP670RE , DLP670S , DLP7000 , DLP7000UV , DLP780NE , DLP780TE , DLP781NE , DLP781TE , DLP800RE , DLP801RE , DLP801XE , DLP9000 , DLP9000X , DLP9000XUV , DLP9500 , DLP9500UV
4.2 Mirror Diffraction Efficiency
The active array area consists of a large rectangular array of aluminum-based mirrors which can tilt to one of two stable angles. For the 13.68 μm, 10.8 μm, and 7.6/7.56 μm micromirror pixel sizes, this is typically +12° and –12° around the diagonal. The 9.0 μm micromirror pixel size also tilts around the diagonal at typically +14.5° and –14.5°. The 5.4 µm micromirror pixels are different in that they tilt approximately 17° about the orthogonal direction.
The illumination and projection f-numbers are typically matched to obtain the tradeoff of efficiency and contrast ratio. However, even under these conditions, there is some loss of light due to clipping of the diffracted light at the projection lens aperture stop. Because the size of the mirrors is not large with respect to the wavelength, the mirror reflected light diffracts into a larger cone angle which results in a loss of light.
The longer wavelengths (red) are diffracted more than shorter wavelengths (blue), resulting in diffraction efficiency that typically decreases at longer wavelengths.
In order to more accurately model the complex diffraction pattern that arises, use the fact that the array of tilted mirrors behaves similarly to a classic blazed optical diffraction grating. Conceptually, the best way to approach broadband source diffraction is to consider it as a combination of a large number of plane waves varying in wavelength and direction. All of these plane wave sources can be combined incoherently to assess the final diffraction pattern.
For a two-dimensional array of mirrors illuminated by a single wavelength, collimated laser beam, the far field appears as an array of bright points (diffraction orders) that are spaced approximately by λ/pitch in angle, where λ is the wavelength. Scalar diffraction theory that can be approximated using the fast Fourier transform algorithm (FFT) can generally be used for this calculation with reasonably good accuracy. The amplitude of the array of bright points is modulated by the far-field pattern of an individual mirror which is generally close to a sin(x)/x shape. The far-field radiance function can be calculated as a function of direction cosines α and β using the Fourier transform as described in Equation 2.
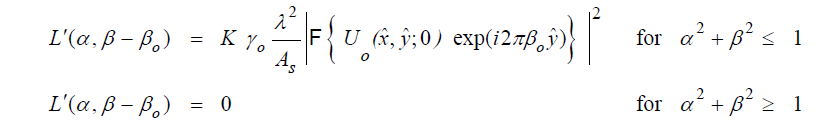
Here, the quantity
 represents the EM field (magnitude and phase) as it leaves
the surface of the DMD mirror array. The calculated radiance profile,
represents the EM field (magnitude and phase) as it leaves
the surface of the DMD mirror array. The calculated radiance profile,
 , can then be mathematically truncated corresponding to the
acceptance angle defined by the projection lens aperture. By integrating the
radiance over incident angle and wavelength and keeping track of the power inside
the aperture relative to the total power, you can calculate the diffraction
efficiency.
, can then be mathematically truncated corresponding to the
acceptance angle defined by the projection lens aperture. By integrating the
radiance over incident angle and wavelength and keeping track of the power inside
the aperture relative to the total power, you can calculate the diffraction
efficiency.
The resulting far-field radiance pattern for a white-light incoherent source has radiating arms of alternating color as shown in Figure 4-1. The energy in the outer arms is lost as only the central part of the beam is collected by the projection lens. The calculated diffraction efficiency varies with mirror pitch, mirror tilt, and wavelength.
Because the far-field diffraction pattern (or image at the projection pupil) depends upon illumination angle, mirror pitch, mirror tilt angle, and wavelength, the far-field diffraction from white light has a significant amount of color variation. The most important factors in determining diffraction-induced color variation are mirror pitch and mirror tilt angle, the illumination angle being less of a factor. This color variation causes the diffraction efficiency to vary approximately as a sinusoid as a function of wavelength as shown in Figure 4-3 through Figure 5-9. A spectral plot of diffraction efficiency shows periodic oscillations in wavelength, and the period of those oscillations generally depends on the pitch of the mirrors—the smaller pitch mirrors showing a longer period. As a result, the diffraction efficiency can change significantly as a function of wavelength. Also, variation in tilt angle across the DMD mirror array and from device to device causes the spectral peaks to shift in wavelength.
Figure 4-2 shows the calculated nominal diffraction efficiency for the various pixel types as a function of pixel pitch. As expected, there is a general reduction in diffraction efficiency as the pixel is scaled down in pitch.
 Figure 4-1 Simulated
5.4 µm Pitch DMD Far Field Radiance Image; Dashed Circle Shows Outline of
Projection Lens Aperture Edge
Figure 4-1 Simulated
5.4 µm Pitch DMD Far Field Radiance Image; Dashed Circle Shows Outline of
Projection Lens Aperture Edge") Figure 4-2 Summary
of Calculated Average Photopic Diffraction Efficiencies for Different Pixel
Sizes (420 nm–680 nm wavelength)
Figure 4-2 Summary
of Calculated Average Photopic Diffraction Efficiencies for Different Pixel
Sizes (420 nm–680 nm wavelength)Figure 4-3 through Figure 5-9 show the spectral diffraction efficiencies for different f-numbers matched between illumination and projection, and nominal design tilt angles.
") Figure 4-3 13.68 µm
Pitch DMD Mirror Calculated Diffraction Efficiency (matched illumination and
projection f-numbers)
Figure 4-3 13.68 µm
Pitch DMD Mirror Calculated Diffraction Efficiency (matched illumination and
projection f-numbers)") Figure 4-4 10.8 µm
Pitch DMD Mirror Calculated Diffraction Efficiency (matched illumination and
projection f-numbers)
Figure 4-4 10.8 µm
Pitch DMD Mirror Calculated Diffraction Efficiency (matched illumination and
projection f-numbers)") Figure 4-5 9.0 µm
Pitch DMD Mirror Calculated Diffraction Efficiency (matched illumination and
projection f-numbers)
Figure 4-5 9.0 µm
Pitch DMD Mirror Calculated Diffraction Efficiency (matched illumination and
projection f-numbers)") Figure 4-6 7.56 µm
Pitch DMD Mirror Calculated Diffraction Efficiency (matched illumination and
projection f-numbers)
Figure 4-6 7.56 µm
Pitch DMD Mirror Calculated Diffraction Efficiency (matched illumination and
projection f-numbers)") Figure 4-7 5.4 µm
Pitch DMD Mirror Calculated Diffraction Efficiency (matched illumination and
projection f-numbers)
Figure 4-7 5.4 µm
Pitch DMD Mirror Calculated Diffraction Efficiency (matched illumination and
projection f-numbers)