SLAA494B May 2011 – September 2023 MSP430AFE221 , MSP430AFE222 , MSP430AFE223 , MSP430AFE231 , MSP430AFE232 , MSP430AFE233 , MSP430AFE251 , MSP430AFE252 , MSP430AFE253
- 1
- Implementation of a Single-Phase Electronic Watt-Hour Meter Using the MSP430AFE2xx
- 1 Trademarks
- 2 Introduction
- 3 Block Diagram
- 4 Hardware Implementation
- 5 Software Implementation
- 6 Energy Meter Demo
- 7 Results
- 8 Important Notes
- 9 Schematics
- 10References
- 11Revision History
7.1 Viewing Results on PC
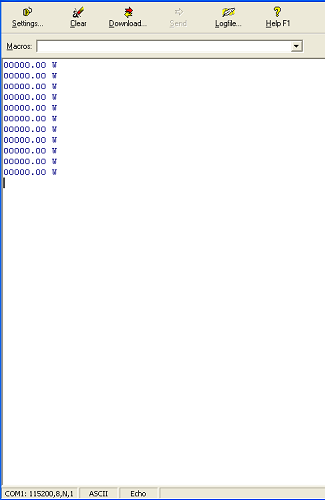
After the meter is turned ON, the results can be viewed using the supplied GUI. Connect the RS-232 header on the EVM to the PC using a DB-9 RS-232 serial cable. Open a terminal program to see a report similar to Figure 7-1. The baud rate settings of the UART are user configurable and are set to 115 kbps by default.
 Figure 7-1 Results Via UART Communication to PC
This is the active power consumption being displayed approximately every second. When a test signal is connected, a non-zero value is reported.