SLAA494B May 2011 – September 2023 MSP430AFE221 , MSP430AFE222 , MSP430AFE223 , MSP430AFE231 , MSP430AFE232 , MSP430AFE233 , MSP430AFE251 , MSP430AFE252 , MSP430AFE253
- 1
- Implementation of a Single-Phase Electronic Watt-Hour Meter Using the MSP430AFE2xx
- 1 Trademarks
- 2 Introduction
- 3 Block Diagram
- 4 Hardware Implementation
- 5 Software Implementation
- 6 Energy Meter Demo
- 7 Results
- 8 Important Notes
- 9 Schematics
- 10References
- 11Revision History
5.2 Foreground Process
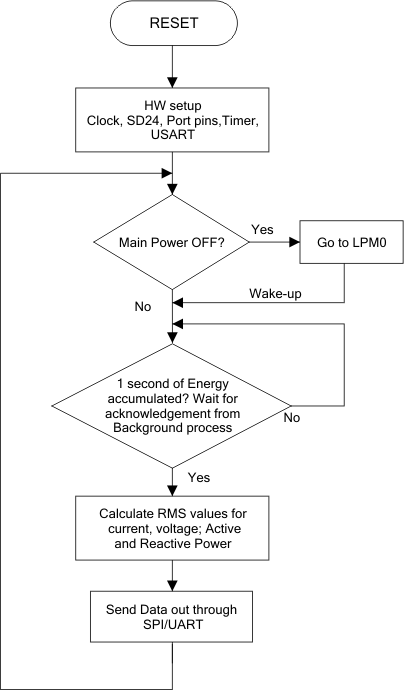
The foreground process includes the initial setup of the MSP430 hardware and software immediately after a device RESET. Figure 5-1 shows the flowchart for this process.
 Figure 5-1 Foreground Process
The initialization routines involves the setup of the analog-to-digital converter, Clock system, general-purpose input/output (GPIO) (port) pins, timer and the USART for UART functionality. A check is made if the main power is OFF and the device goes into LPM0. During normal operation, the background process notifies the foreground process through a status flag every time a frame of data is available for processing. This data frame consists of accumulation of energy for 1 second. This is equivalent to accumulation of 50 or 60 cycles of data samples synchronized to the incoming voltage signal. In addition, a sample counter keeps track of how many samples have been accumulated over the frame period. This count can vary as the software synchronizes with the incoming mains frequency. The data samples set consist of processed current, voltage, active and reactive energy. All values are accumulated in separate 48-bit registers to further process and obtain the RMS and mean values.