SLVAF10 March 2021 TPS1H000-Q1 , TPS1H100-Q1 , TPS1H200A-Q1 , TPS1HA08-Q1 , TPS1HB08-Q1 , TPS1HB16-Q1 , TPS1HB35-Q1 , TPS1HB50-Q1 , TPS2H000-Q1 , TPS2H160-Q1 , TPS2HB16-Q1 , TPS2HB35-Q1 , TPS2HB50-Q1 , TPS4H000-Q1 , TPS4H160-Q1
3.2.2 Power Impact of Delay Mismatch on Resistive Loads
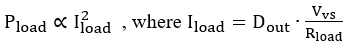
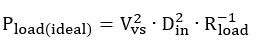
The reduction of output pulse-width accuracy has an even greater effect on the accuracy of power delivered to a resistive load since load power is proportional to the square of the current delivered.
LED power analysis taking the example of a resistive load scenario:
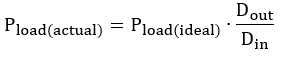
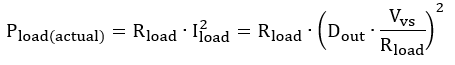
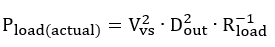
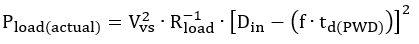
Substituting input duty cycle from Equation 47,
We can visualize the worst-case effects of pulse-width distortion on a resistive load scenario with the following conditions:
- HSS supply voltage: Vvs = 10 V
- Load resistance: Rload = 10 Ω
- PWM Duty Cycle: DIN = 50%
- Pulse-width distortion: td(PWD) = ±50 μs (TPS4H000-Q1 min/max spec)
We can also quantify the variation of actual power dissipation due to compared to ideal.
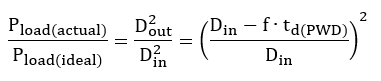
Using the example of TPS4H000-Q1,
- PWM Duty Cycle: DIN = 50%
- Pulse-width distortion: td(PWD) = ±50 μs (TPS1H100 min/max spec)
We can see that if we consider a worst-case PWD scenario of TPS4H000-Q1, switching frequency is virtually limited to below 1 kHz again if relatively accurate load power is desired at 50% duty cycle. This figure is even lower if high accuracy is required at low duty cycles.
 Figure 3-6 Potential Load Power Variation for TPS4H000, Normalized