SBOA444 November 2020 TMCS1100
4.2 Foreground Process
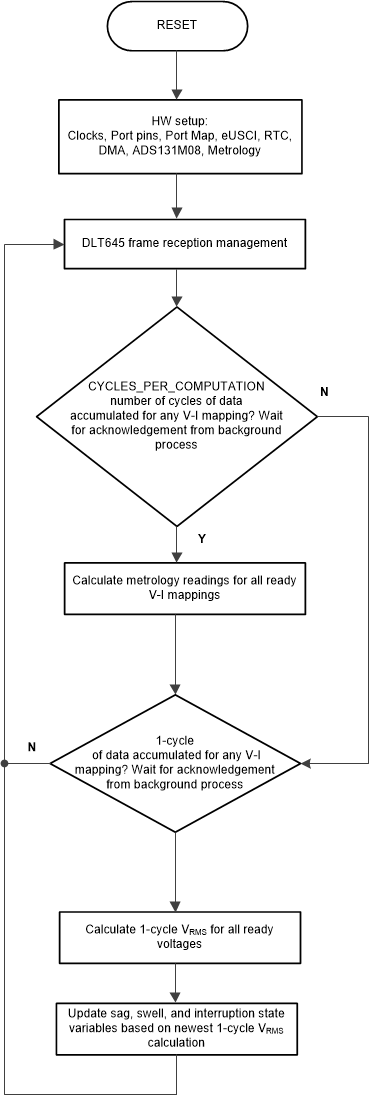
The foreground process includes the initial setup of the MSP432 hardware and software and the ADS131M08 registers immediately after a device RESET. The Foreground Process figure shows the flowchart for this process. In the diagram, V-I mappings are referring to the combinations of the common voltage and the individual current channels. There are a total of three V-I mappings: the mapping between the voltage and current channel A, the mapping between the voltage and current channel B, and the mapping between the voltage and current channel C.
 Figure 4-2 Foreground Process.
After the hardware is setup, any received frames from the GUI are processed. Next, the foreground process checks whether the background process has notified the foreground process to calculate new metrology parameters for any voltage-current mappings. This notification is accomplished through the assertion of the "PHASE_STATUS_NEW_LOG" status flag whenever a frame of data is available for processing. The data frame consists of the processed dot products that were accumulated for CYCLES_PER_COMPUTATION number of cycles of data. The value for CYCLES_PER_COMPUTATION is 10 cycles when the nominal frequency setting in the software is 50 Hz and 12 cycles when the nominal frequency setting in the software is set to 60 Hz. When the measured line frequency is equal to the nominal frequency of the design, this is equivalent to 200 milliseconds of accumulated data.
The processed dot products include the VRMS, IRMS, active power, reactive power, fundamental voltage, fundamental active power, and fundamental reactive power. These dot products are used by the foreground process to calculate the corresponding metrology readings in real-world units. All the processed dot products are accumulated in separate 64-bit registers to further process and obtain the RMS and mean values. Using the calculated values of active and reactive power of the foreground process, the apparent power is calculated. Similarly, using the calculated values of the foreground for the fundamental voltage, fundamental reactive power, and fundamental active power, the fundamental current, fundamental apparent power, voltage THD, and current THD are calculated. Additionally, voltage underdeviation and voltage overdeviation are calculated using the value of the calculated RMS voltage and the defined Nominal voltage of the design. The frequency (in Hz) and power factor are also calculated using parameters calculated by the background process using the formulas in the Formulas section.
The foreground process is also responsible for calculating the 1-cycle VRMS readings that are used to update the sag, swell, and interruption state logging variables. The 1-cycle VRMS readings are triggered by the background process after every negative to positive zero crossing. After the new VRMS reading, the following state variables are updated accordingly:
Swell variables
Swell_events: This variable logs the total number of swell events that have occurred since the design was first reset. The start of a swell event occurs whenever the 1-cycle RMS is above a user-defined sag. The end of a swell threshold event occurs when the 1-cycle RMS is below the user-defined swell threshold minus a user-defined hysteresis value.
Max_swell_value: This variable is the maximum 1-cycle RMS reading that was observed during the current ongoing swell event. If a swell event is not currently occurring, this variable represents the maximum 1-cycle RMS reading during the previously completed swell event.
Swell_duration: This variable logs the number of cycles during the current ongoing swell event. If a swell event is not currently occurring, this variable represents the duration of the previously completed swell event.
Sag Variables
Sag_events: This variable logs the total number of sag events that have occurred since the design was first reset. The start of a sag event occurs whenever the 1-cycle RMS is below a user-defined sag threshold but is still greater than the user-defined interruption threshold. The end of a sag event occurs when the 1-cycle RMS is above the user-defined sag threshold plus a user-defined hysteresis value.
Min_sag_value: This variable is the minimum 1-cycle RMS reading that was observed during the current ongoing sag event. If a sag event is not currently occurring, this variable represents the minimum 1-cycle RMS reading during the previously completed sag event.
Sag_duration: This variable logs the number of cycles during the current ongoing sag event. If a sag event is not currently occurring, this variable represents the duration of the previously completed sag event.
Interruption Variables
Interruption_events: This variable logs the total number of interruption events that have occurred since the design was first reset. The start of an interruption event occurs whenever the 1-cycle RMS is below a user-defined interruption threshold, which is lower than the sag voltage threshold.
Interruption_duration: This variable logs the number of cycles during the current ongoing sag event. If a sag event is not currently occurring, this variable represents the duration of the previously completed interruption event. Note that this variable does not increment when there is no voltage applied to the design since there are no cycles to count; however, the absence of voltage is still able to be counted as an interruption event.