SLVAFF1 January 2023 DRV8452 , DRV8462
PRODUCTION DATA
- Abstract
- Trademarks
- 1Power Efficiency of Stepper Motor Drivers
-
2Auto-Torque
- 2.1 Auto-Torque: Learning Principle
- 2.2 Current Control
- 2.3 PD Control Loop
- 2.4
Impact of Auto-Torque Tuning
Parameters
- 2.4.1 Impact of Learning Parameters on Load Transient Response
- 2.4.2 Impact of ATQ_UL, ATQ_LL Hysteresis
- 2.4.3 Impact of Load Profile on Power Saving
- 2.4.4 Adaptive ATQ_UL, ATQ_LL
- 2.4.5 PD Parameter Dependency Curves
- 2.4.6 ATQ_CNT at Different Motor Speeds
- 2.4.7 ATQ_CNT at Different Supply Voltages
- 2.4.8 Motor Temperature Estimation
- 2.5 Efficiency Improvement With Auto-Torque
- 3Case Studies
- 4Summary
- 5References
2.4.6 ATQ_CNT at Different Motor Speeds
Figure 2-29 ATQ_CNT as a Function of Motor
Speed
Figure 2-29 shows how ATQ_CNT varies with motor speed with all other operating conditions remaining same. As is evident, there are two distinct segments with different slopes in the ATQ_CNT vs. speed plot.
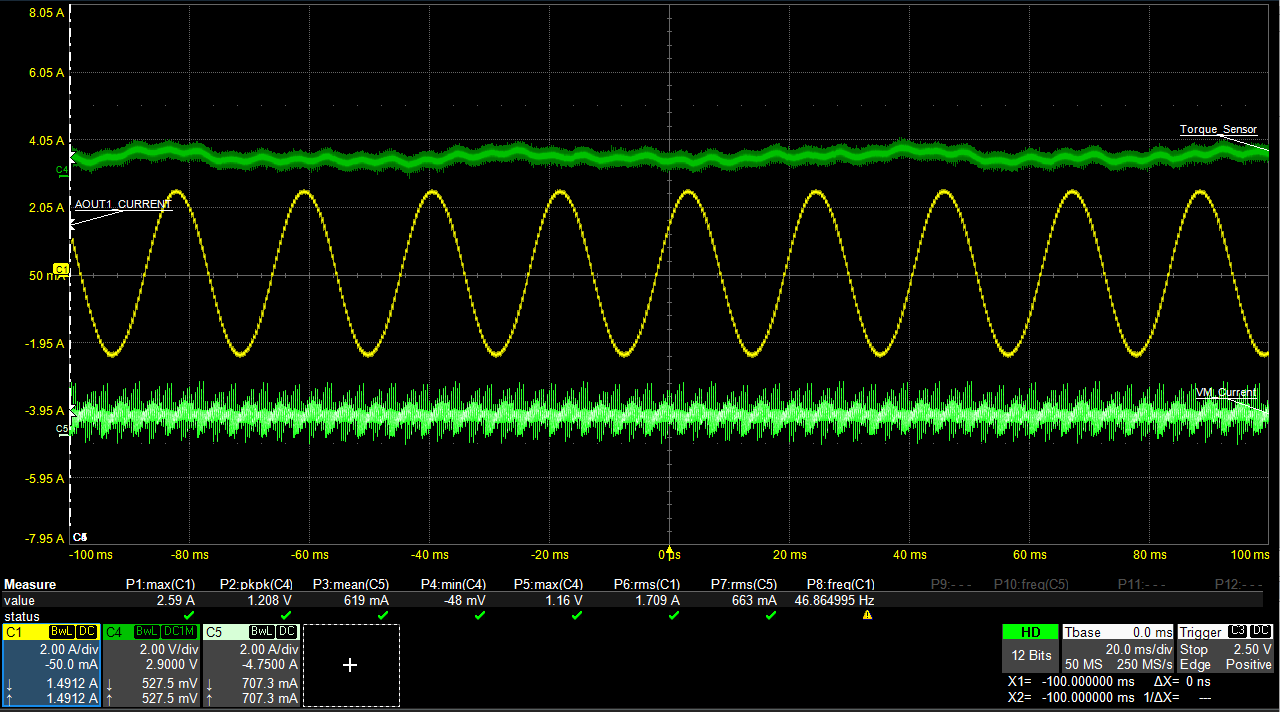
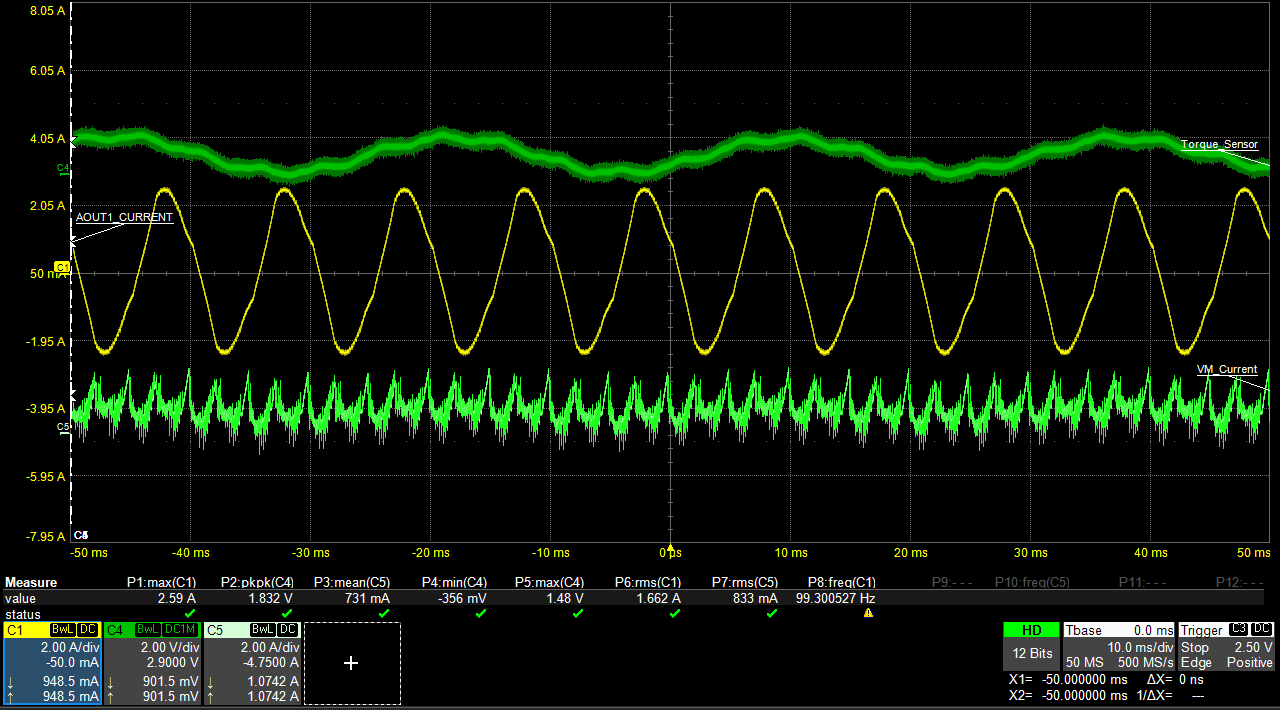
- The segment with lesser slope corresponds to sinusoidal current waveforms, as shown in Figure 2-30 and Figure 2-31.
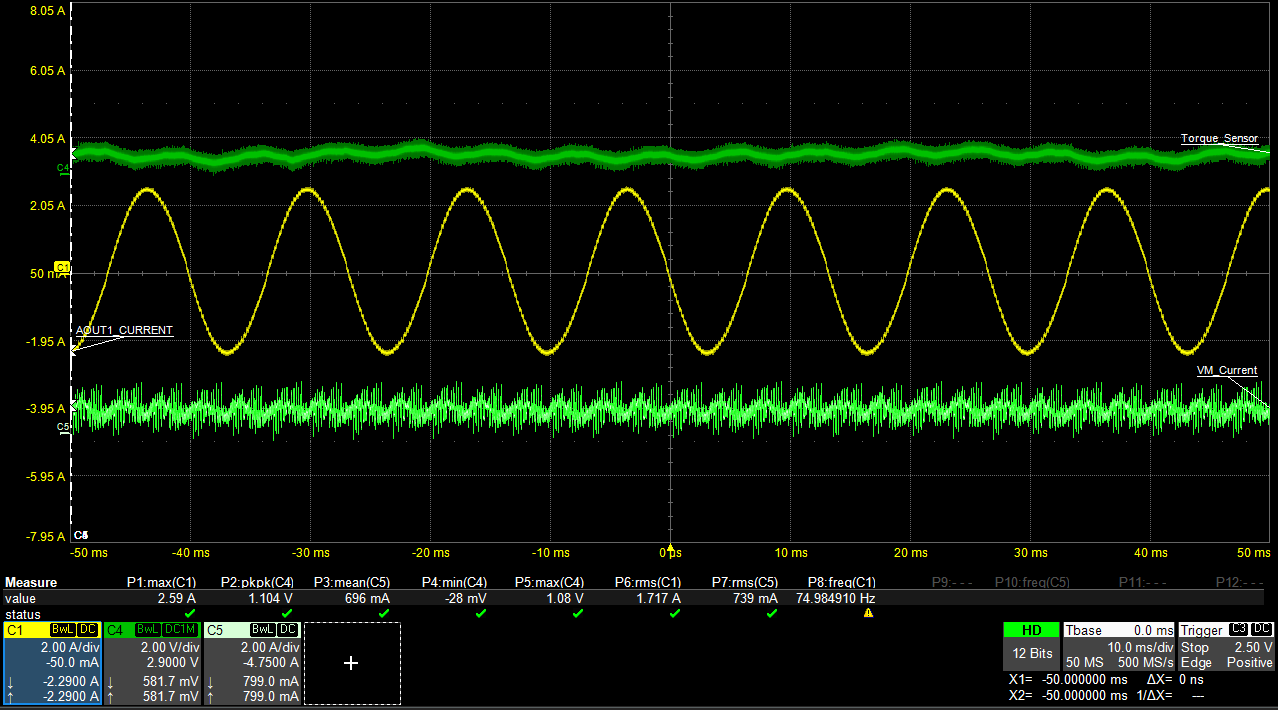
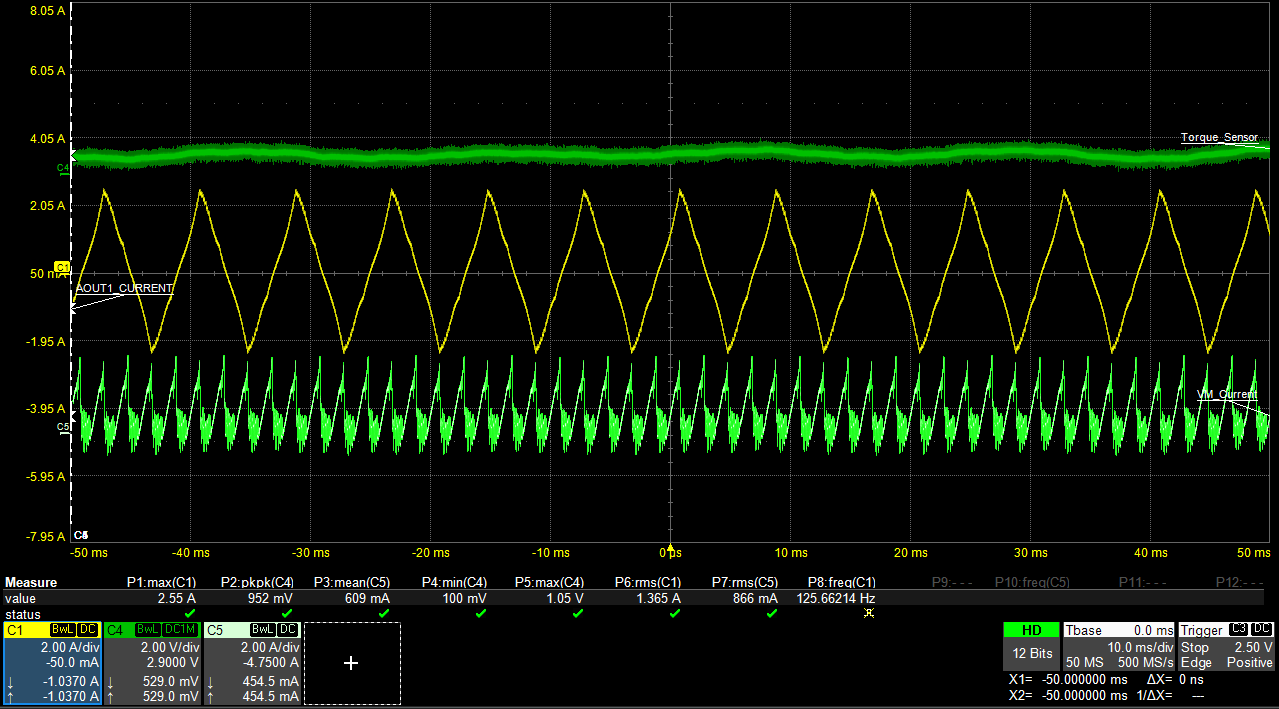
- At higher speeds, when the current waveform starts becoming triangular (as shown in Figure 2-31 and Figure 2-33), the ATQ_CNT vs. speed plot has a steeper slope.
- For a given range of motor speed,
firmware can adjust the ATQ_LRN parameters and ATQ_UL, ATQ_LL based on a curve like Figure 2-29.
- To start with, user can vary the motor speed and plot this curve at maximum current.
- During normal operation, at any speed, they can find the correction factor from the curve and apply it to the ATQ_LRN parameters, ATQ_UL and ATQ_LL.
 Figure 2-30 3000 pps Step
Frequency
 Figure 2-32 6400 pps Step Frequency
 Figure 2-31 4800 pps Step
Frequency
 Figure 2-33 8000 pps Step
Frequency