SNOAA61A October 2020 – February 2021 LMG3422R030 , LMG3422R050 , LMG3425R030 , LMG3425R050
5 Experimental Setup and RθJC/P Testing Results
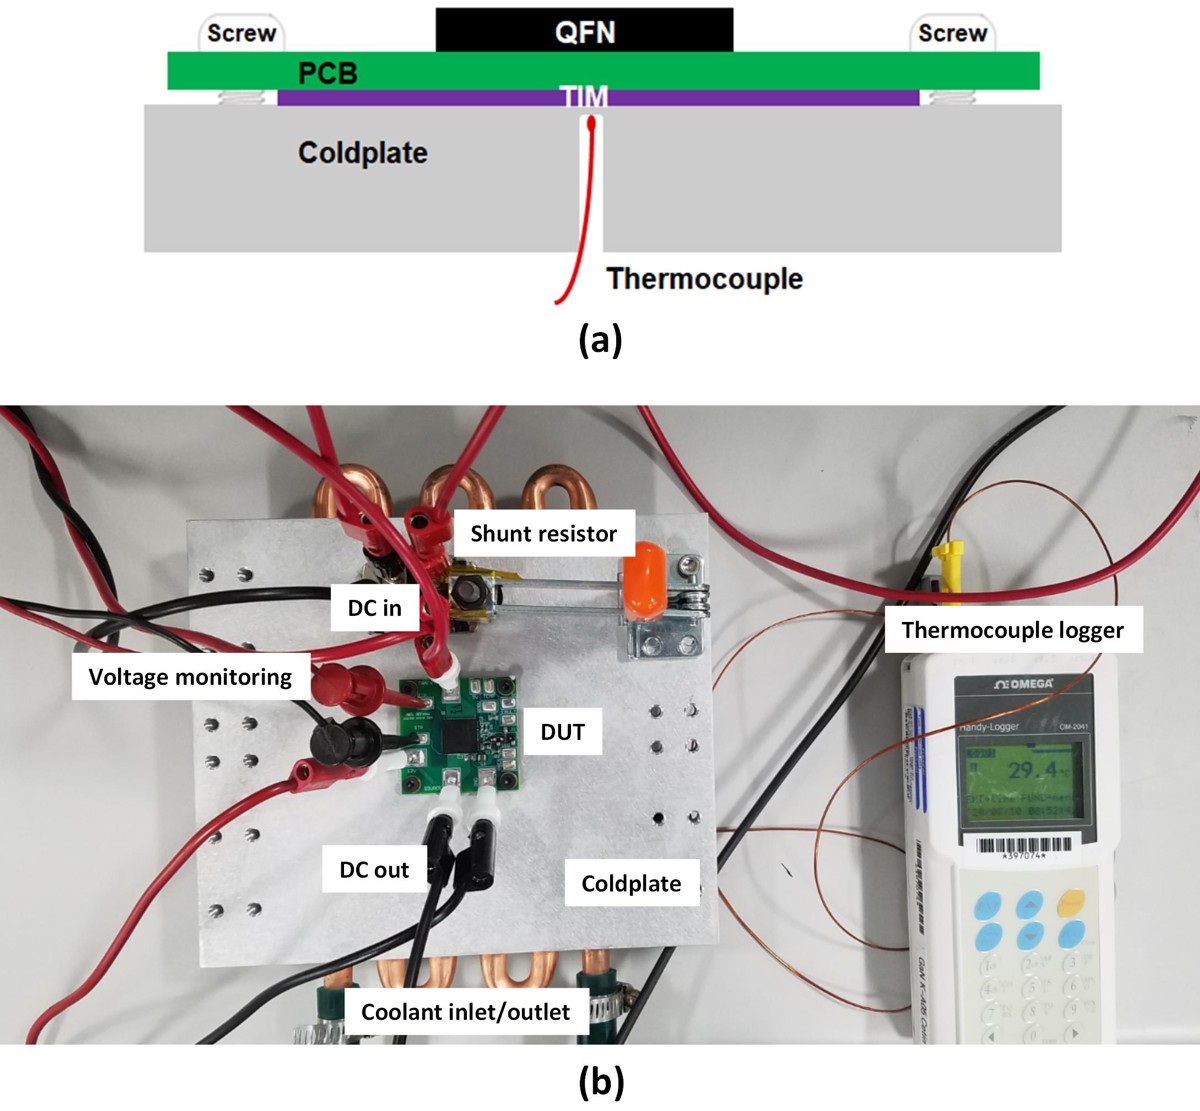
To verify the thermal simulation results, a test bench setup for thermal resistance measurement has been designed and implemented. The 30-mΩ device in the QFN 12x12 package (LMG342xR030) was selected to investigate the consistency between simulation and experiment results. Following the simulation model construction design, a 4-layer PCB for thermal testing was populated and a LMG342xR030 unit was mounted on the center of it. It is exhibited in Figure 5-1 that the testing vehicle was pressed on a machined coldplate (Hi-Contact 6-Pass, Aavid) under approximately 20-psi pressure provided by mounting screws on four corners of the board. A 1-mm-thick gap filler pad TIM (GR80A, Fujipoly) was inserted between the exposed PCB bottom Cu pad and the coldplate which is connected to a chiller unit (6560M, PolyScience) with a running liquid coolant of 30 °C. For measuring the cooling plane temperature (TC/P), a thermocouple tip was placed 2 mm underneath the top surface of coldplate through a drilled 2.5-mm-diameter blind hole. TC/P was read and recorded by a data logger (OM-2041, Omega). To generate a controlled loss inside the package, direct current was used to heat the device junction, and the dissipated power was calculated by voltage and current measured across the testing unit.
 Figure 5-1 Experimental Setup for Rθ Measurement:
(a) Cross-Section Illustration and (b) Top-View
Photo
Figure 5-1 Experimental Setup for Rθ Measurement:
(a) Cross-Section Illustration and (b) Top-View
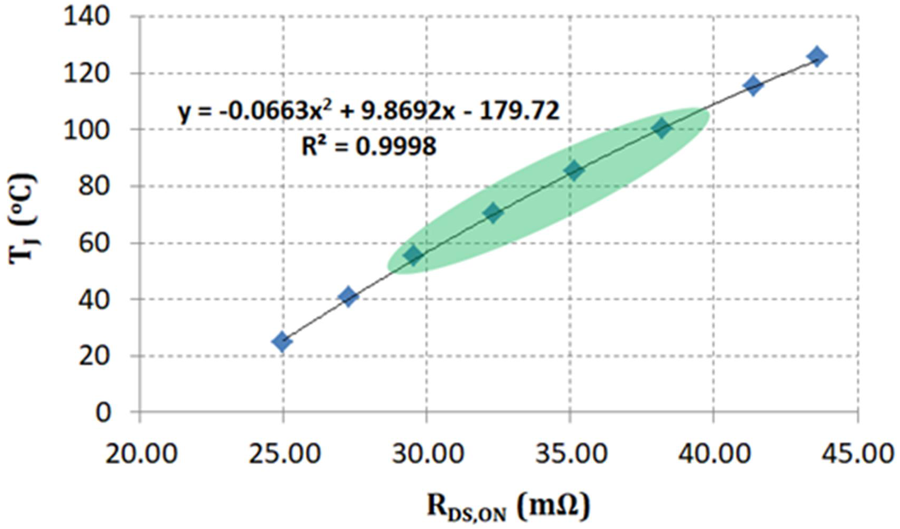
PhotoAs a temperature sensitive parameter, the on-resistance (RDS,ON) of monitored device was utilized to calculate junction temperature (TJ) in thermal resistance measurement. Before testing, the RDS,ON – TJ correlation of the testing unit was calibrated inside a thermal chamber (107, TestEquity) where the device junction was passively heated by the temperature controlled environment. Active heating of the junction was minimized owing to the small measuring current of only 80-100 mA. An example calibration curve with a fitting equation for the measured temperature range of 25-125 °C is presented in Figure 5-2. Another method to estimate TJ is to use an infra-red (IR) thermal camera to directly measure the hot spot on top of the package during testing. As mentioned in Section 3.1, very minimal heat is dissipated from the package top side in an efficient bottom-side cooling system. The measured top case temperature is therefore very close to device TJ.
 Figure 5-2 Calibration Curve for RDS,ON and
TJ Correlation
Figure 5-2 Calibration Curve for RDS,ON and
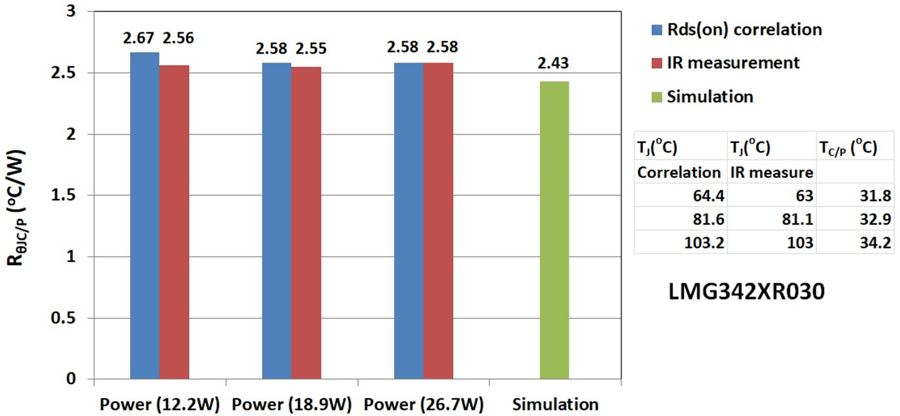
TJ CorrelationFigure 5-3 shows the measured maximum top case temperature of a LMG342xR030 device tested under different dissipated powers. The testing results of RθJC/P calculated from both RDS,ON – TJ correlation and IR measurement are summarized in Figure 5-4 . There is no distinctive difference of RθJC/P results obtained from two methods under three different tested power levels. Furthermore, a satisfactory agreement (< 8% discrepancy) between simulation and experiment results is also noticed, which verifies the thermal simulation results for package competitive analysis described in Figure 4-5. Explanations for the slightly higher RθJC/P from measurement could be the imperfections of the testing vehicle and setup which are not considered in the simulation model, such as barrel cracking of the PCB thermal vias, solder void in the joint layer between device thermal pad and PCB mounting area, and uneven pressure applied on TIM.
 Figure 5-3 IR Thermal
Images for QFN 12x12 Unit Tested on Different Power
Levels
 Figure 5-4 Experimental Results of RθJC/P Tested on
Different Power Levels
Figure 5-4 Experimental Results of RθJC/P Tested on
Different Power LevelsAs indicated in Figure 4-5, the RθTIM contributes more than 40% of RθJC/P for the investigated cooling system, which is critical for the overall system thermal performance (RθJA) in real applications. However, the thermal conductivity of TIM published in datasheet by different manufacturers is difficult to use for material down-select because they are not always measured using the same methodology. Therefore, a bench testing is preferably needed to choose a proper TIM to be used in the system. Different TIMs were tested in this reported work using the same experimental setup so as to compare their thermal characteristics. The testing results and other related information were summarized in Table 5-1. It is demonstrated that using the same TIM (GR80A) in a thinner format (0.5 mm) or a more thermally conductive TIM (GR130A) from the same manufacturer can effectively reduce the RθJC/P. TIM A material obtained from another vendor shows similar thermal performance as the benchmark GR80A TIM but has a lower thermal conductivity reported in its datasheet, while TIM B material lists a high thermal conductivity of 20 W/mK but its performance is equivalent to GR130A TIM with claimed 13 W/mK thermal conductivity. Adhesive tape is another commonly used TIM which does not require additional clamping force to secure the cooling elements on the PCB or other heated surfaces after initial installation. This material is cheaper but its thermal resistance is higher compared to gap filler pad TIM. The testing result for TIM C listed in Table 5-1 is given as an example. The measured RθJC/P using tape TIM is considerably higher than that using the gap filler pad TIM, which is much thicker.
| PRODUCT | TYPE | THICKNESS (mm) | THERMAL CONDUCTIVITY (W/mk) on DATASHEET | COST | RθJC/P (°C/W) |
|---|---|---|---|---|---|
| GR80A | Gap filler pad | 1 | 8 | x1 | 2.58 |
| GR80A | Gap filler pad | 0.5 | 8 | X0.7 | 2.33 |
| GR130A | Gap filler pad | 1 | 13 | x3 | 2.21 |
| TIM A | Gap filler pad | 1 | 7.5 | X1.1 | 2.60 |
| TIM B | Gap filler pad | 1 | 20 | X2 | 2.26 |
| TIM C | Tape | 0.25 | 1.2 | x0.07 | 5.72 |