SLOA277B january   2019  – july 2023 LM124 , LM124-N , LM124A , LM158 , LM158-N , LM158A , LM224 , LM224-N , LM224A , LM258 , LM258-N , LM258A , LM2902 , LM2902-N , LM2902-Q1 , LM2902K , LM2902KAV , LM2904 , LM2904-N , LM2904-Q1 , LM2904B , LM2904B-Q1 , LM2904BA , LM321 , LM324 , LM324-N , LM324A , LM358 , LM358-N , LM358A , LM358B , LM358BA , TS321 , TS321-Q1


  1.   1
  2.   Abstract
  3.   Trademarks
  4. 1Devices Covered in Application Note
    1. 1.1 Common Schematic
    2. 1.2 Base Part Numbers
    3. 1.3 Input Voltage Offset Grades
    4. 1.4 Maximum Supply Voltage
    5. 1.5 High Reliability Options
    6. 1.6 HBM ESD Grade
    7. 1.7 LM358B, LM358BA, LM2904B, LM2904BA, LM324B, LM2902B
  5. 2Input Stage Considerations
    1. 2.1 Input Stage Schematic
    2. 2.2 Input Common Mode Range
    3. 2.3 Input Impedance
    4. 2.4 Phase Reversal
  6. 3Output Stage Considerations
    1. 3.1 Output Stage Schematic, VOL and IOL
    2. 3.2 IOL and Common Mode Voltage
    3. 3.3 Output Stage Schematic, VOH and IOH
    4. 3.4 Short Circuit Sourcing Current
    5. 3.5 Output Voltage Limitations
  7. 4AC Performance
    1. 4.1 Slew Rate and Bandwidth
    2. 4.2 Slew Rate Variability
    3. 4.3 Output Crossover Time Delay
    4. 4.4 First Crossover Example
    5. 4.5 Second Crossover Example
  8. 5Low VCC Guidance
    1. 5.1 Low VCC Input Range Supporting –40°C
    2. 5.2 Low VCC Output Range Supporting –40°C
    3. 5.3 Low VCC Audio Amplifier Example
  9. 6Comparator Usage
    1. 6.1 Op Amp Limitations
    2. 6.2 Input and Output Voltage Ranges
    3. 6.3 Overload Recovery
    4. 6.4 Slew Rate
  10. 7Unused Amp Connections and Inputs Connected Directly to Ground
    1. 7.1 Do Not Connect Inputs Directly to Ground
    2. 7.2 Unused Amplifier Connections
  11. 8Conclusion
  12. 9Revision History

Slew Rate

Slew rate (SR) limits the output rise and fall times, which are defined as (VOH – VOL)/SR. Slew rate, as specified in the op amp data sheet, is applicable for large differential input voltages. Dedicated comparator parts, on the other hand, may have much smaller differential input voltages. Note that the slew rate is reduced when the input difference voltage is small. Figure 6-3 shows that an input difference of 100 mV provides a slew rate 90% as fast as the data sheet setup result and a 10-mV input difference voltage has a slew rate that is only 16% of the data sheet slew rate.
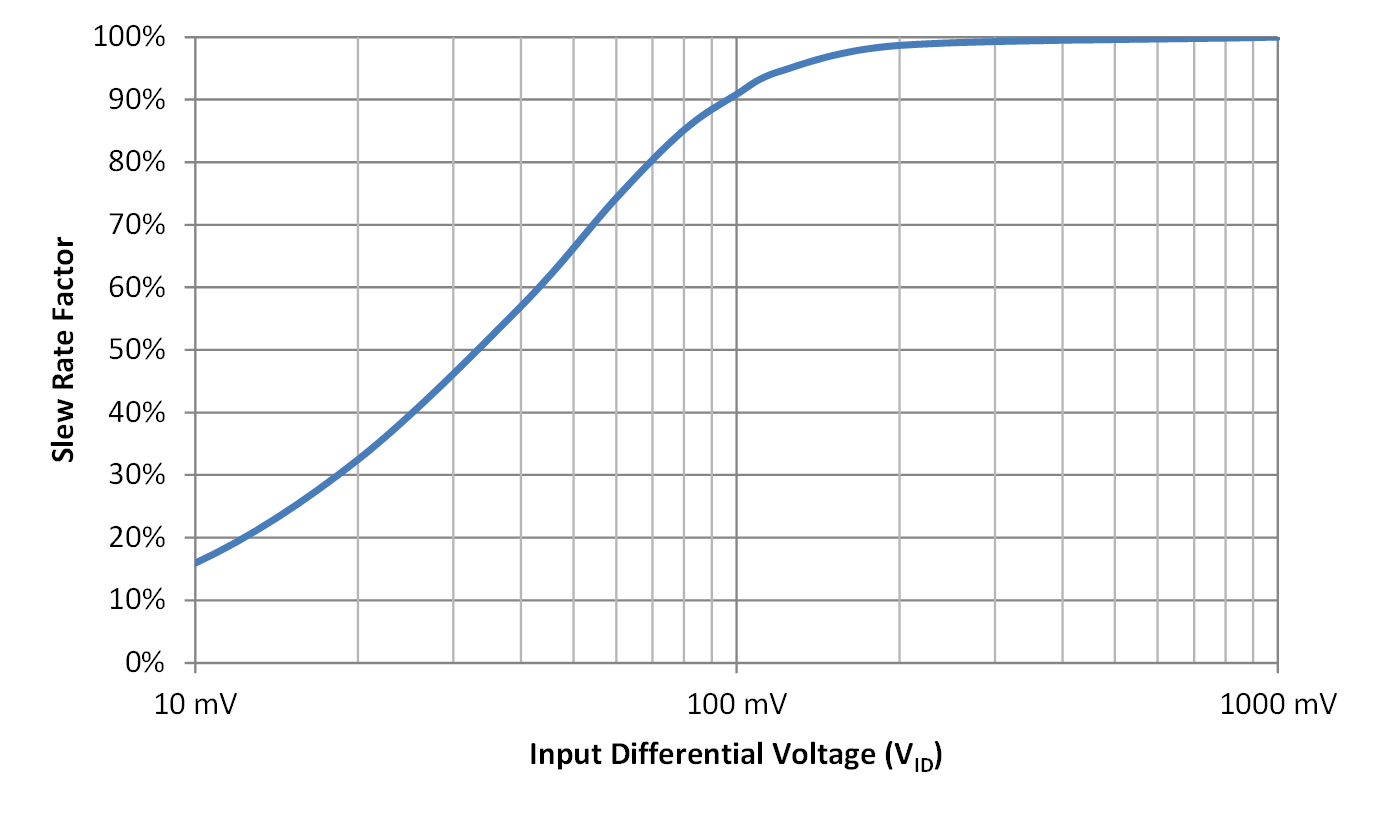
GUID-41EBE6C2-21C1-49F3-8928-79DB2FD4BA58-low.gifFigure 6-4 Slew Rate Factor vs Input Differential Voltage (VID)