SBOA345 June 2021 ADC10D1000QML-SP , ADC12D1600QML-SP , ADC12D1620QML-SP , INA1620 , OPA132 , OPA134 , OPA1602 , OPA1604 , OPA1611 , OPA1612 , OPA1622 , OPA1632 , OPA1637 , OPA1641 , OPA1642 , OPA1644 , OPA1652 , OPA1654 , OPA1655 , OPA1656 , OPA1662 , OPA1664 , OPA1671 , OPA1677 , OPA1678 , OPA1679 , OPA1688 , OPA1692 , OPA2132 , OPA2134 , OPA4132 , OPA4134
3.1 Taking a Deeper Look at Noise Sources
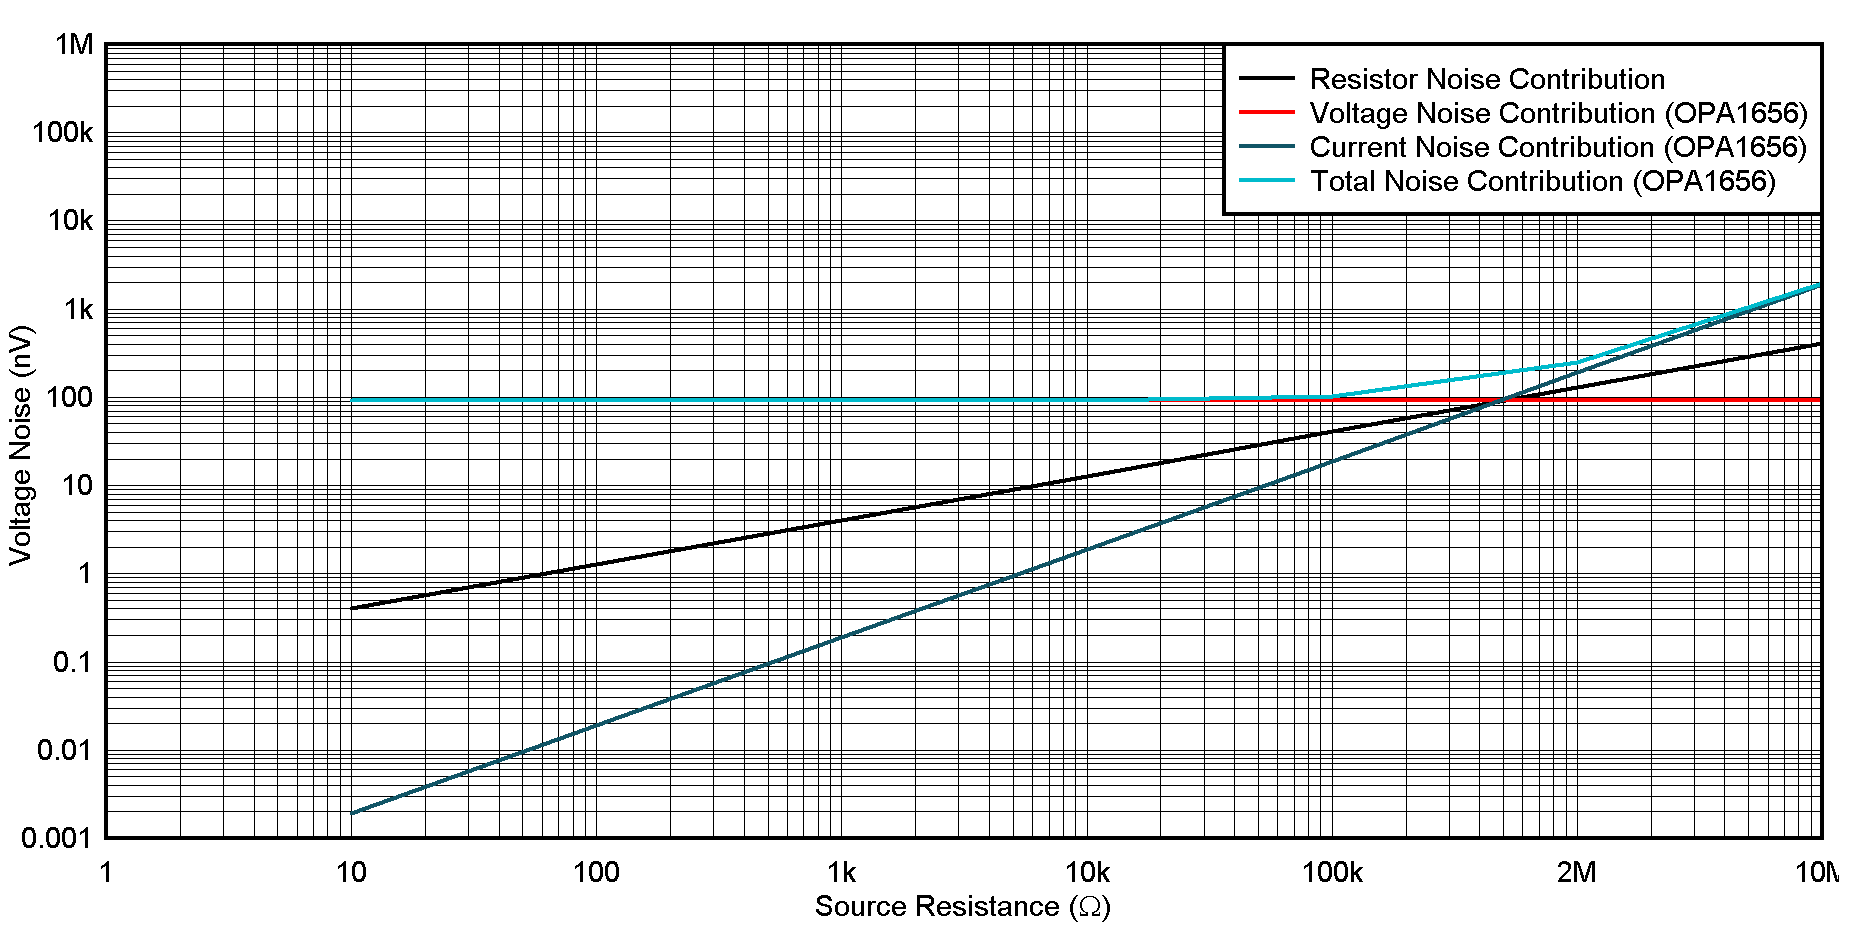
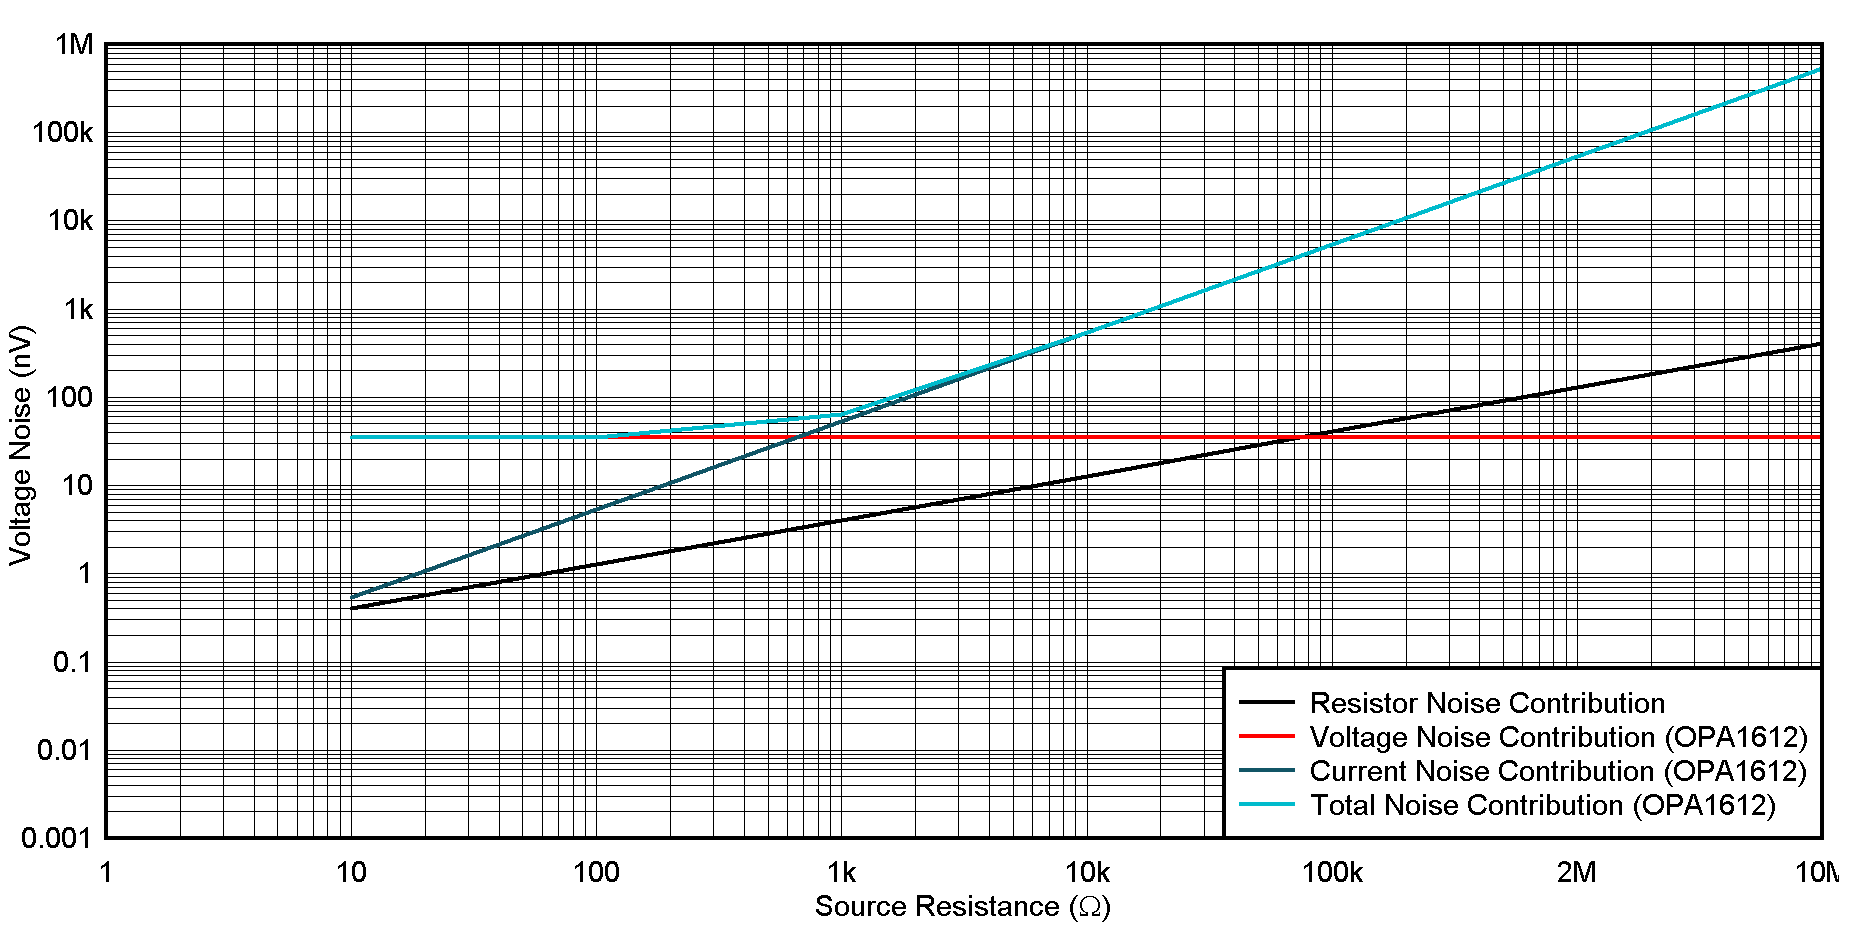
Using the OPA1656 and OPA1612 we can see how the different noise sources can affect the overall noise. Using excel we can plot out the voltage noise, current noise, and resistance noise vs resistance values. For this example, the frequency is set to 1kHz.
 Figure 3-2 OPA1656 Noise
Curves
 Figure 3-3 OPA1612 Noise
Curves
Figure 3-3 OPA1612 Noise
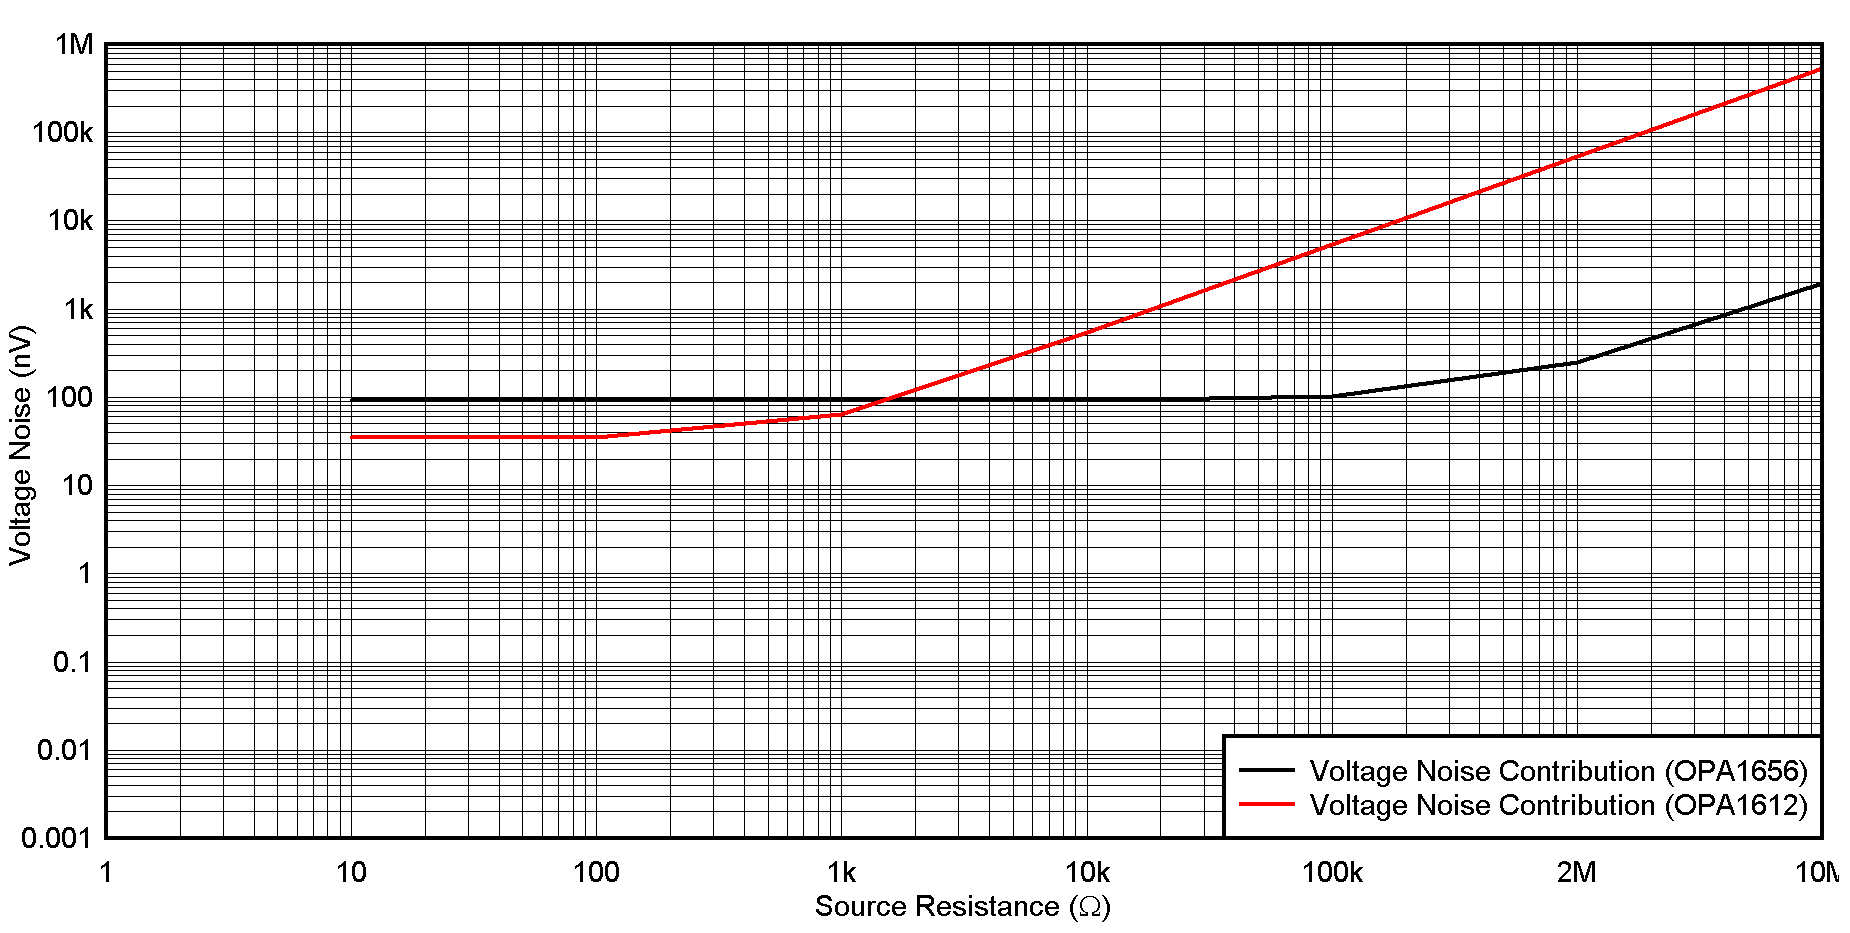
CurvesAs the source resistance increases, the overall noise of the OPA1612 will eventually dominate that of the OPA1656 due to the current noise. For this reason, it is paramount to understand the system and all its noise contributions before choosing an amplifier.
 Figure 3-4 Total Noise of OPA1656 vs
OPA1612