SBAA436 March 2021 REF34-Q1 , REF3425 , REF3425-EP , REF3430 , REF3430-EP , REF3433 , REF3433-EP , REF3440 , REF3440-EP , REF3450 , REF4132 , REF4132-Q1 , REF50 , REF5020-EP , REF5020A-Q1 , REF5025-EP , REF5025-HT , REF5025A-Q1 , REF5030A-Q1 , REF5040-EP , REF5040A-Q1 , REF5045A-Q1 , REF5050-EP , REF5050A-Q1 , REF50E , REF6125 , REF6133 , REF6141 , REF6145 , REF6150 , REF6225 , REF6230 , REF6233 , REF6241 , REF6245 , REF6250 , REF70
6 Temperature Effect
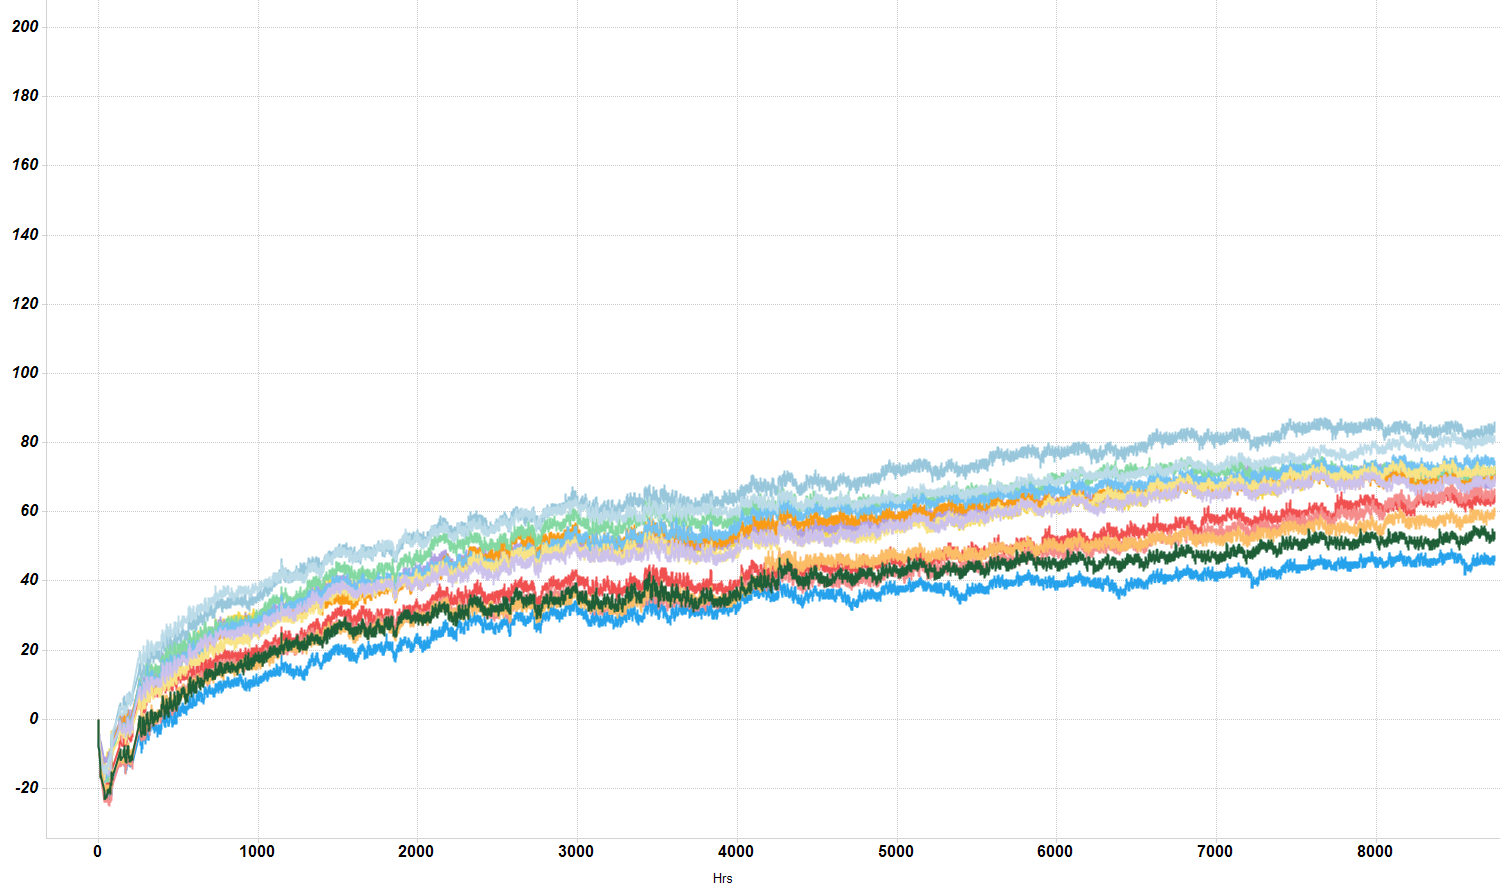
The LTD curve of a typical device has the majority of the deviation within the first 100 hr. During the first 100 hr the device experiences the largest shift due to the mold curing. As time passes, the mold cures and the effect of the mold compound reduces. The LTD of the device will "settle" but it can keep increasing due to other stresses the die might experience such as PCB stress. Figure 6-1 shows the REF50 LTD deviation for 1year. After 1yr (8760 hr), the deviation of the REF50 is 60 ppm with the majority of the deviation before the first initial 1000 hr.
 Figure 6-1 REF50 - VSSOP Package LTD
35°C
Figure 6-1 REF50 - VSSOP Package LTD
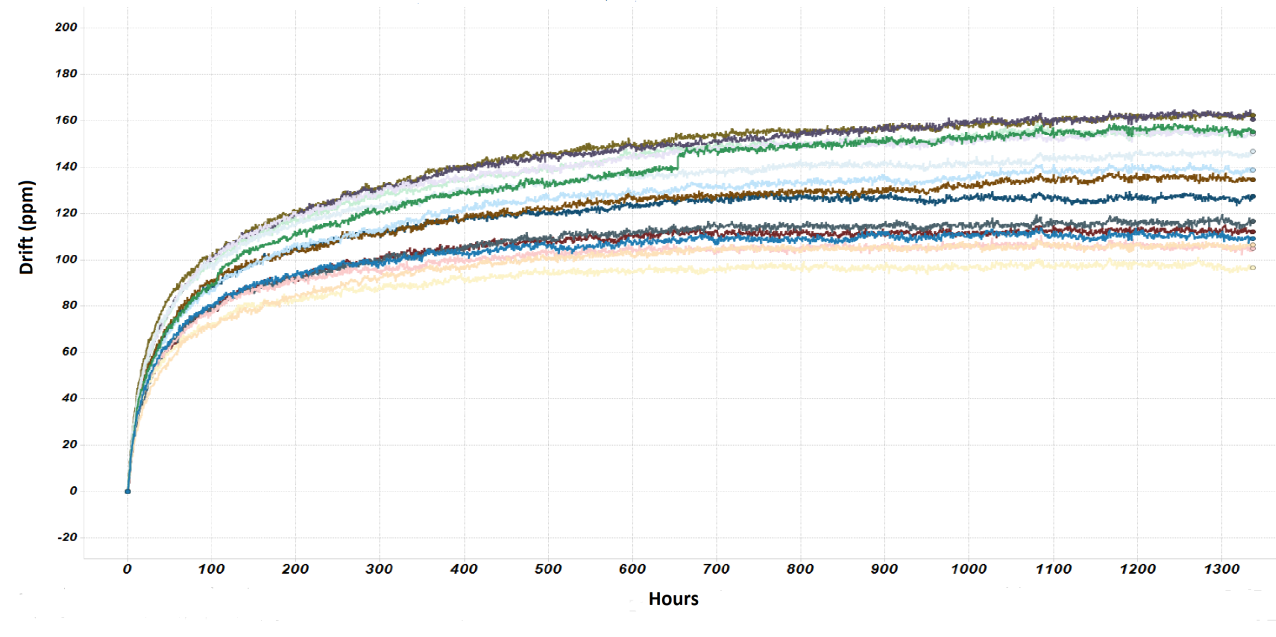
35°CTemperature accelerates the stress settling factor and hence the LTD profile settles within a low drift coefficient earlier at higher temperature. In Figure 6-2, the LTD profile is settling after 100 hours at 85°C temperature. After 400 hr, the REF50 has a flat settled behavior with minimal deviation. There is device to device variation in how long it takes to reach a settled behavior.
 Figure 6-2 REF50 - VSSOP Package LTD 85°C