SBAU279 October 2020 ADS7038-Q1
- Trademarks
- 1Introduction
- 2ADS7038Q1EVM-PDK Overview
- 3ADS7038Q1EVM-PDK Initial Setup
- 4Input Signal-Conditioning Circuitry on the ADS7038Q1EVM
- 5Bill of Materials, Printed Circuit Board Layout, and Schematics
3.3.3.1.1 Time Domain Display
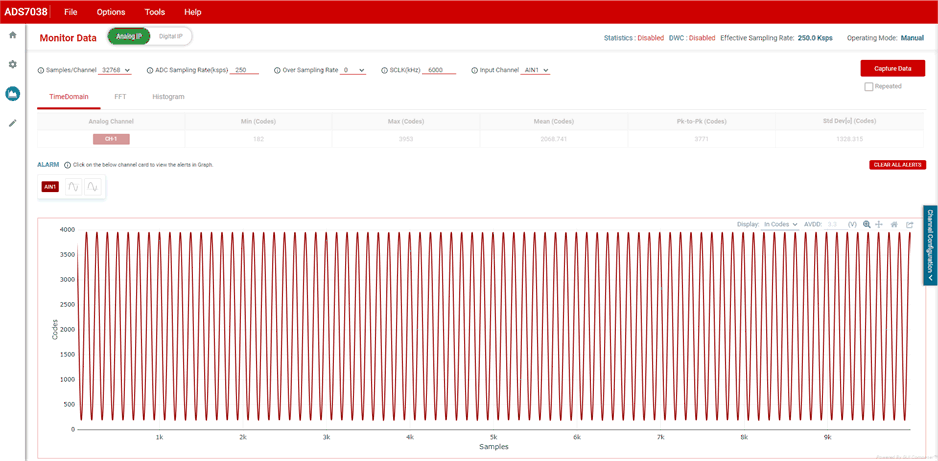
The time domain graph displays the conversion results of an analog input channel of the sampled data set. The data captured is displayed as code value vs sample number. The number of samples can be increased in the Samples/Channel drop-down menu. The data can also be displayed in the volt equivalent of sample captured instead of the code value, based on the ideal +3.3-V AVDD voltage.
When in manual mode, the graph can only display one analog input conversion results at a time; the drop-down option Input Channel allows changing which channel is displayed. When the device is operating in auto-sequence mode, all the analog input channels selected will be displayed on the graph.
The data can also be exported by clicking the last icon at the right corner of the graph display. Figure 3-13 shows the time domain display.
 Figure 3-13 Time Domain Data Analysis Display.