SLAAED0 March 2024 TAS2764 , TAS2780 , TAS2781
- 1
- Abstract
- Trademarks
- 1 Introduction
- 2 Measurement Methodology
- 3 Introduction to Noise-gate and Pop in Class-D Amplifiers
- 4 Causes of Pop in TAS27xx family of Class-D Amplifiers
- 5 Click and Pop Using TAS27xx
-
6 Click and Pop Measurement Technique Using
AP v6.0. 2
- 6.1 Measurement Setup
- 6.2 Filter Settings
- 6.3 Data Capture Settings
- 6.4 Auto Range Settings for Pop Measurement
- 6.5 ASI or I2S Configurations for Pop Measurement
- 6.6 APx Sound Level Meter Utility
- 6.7 Data Acquisition
- 6.8 Interpreting Click and Pop Waveforms
- 6.9 Post Processing of AP Waveforms
- 6.10 A-Weighted Click and Pop Numbers
- 6.11 Exporting the A-Weighted Numbers
- 7 Noise-Gate Pop and Measurement Technique Using APx
- 8 Configuring TAS2764 for Improved Click and Pop Noise Performance
- 9 Summary
- 10References
6.8 Interpreting Click and Pop Waveforms
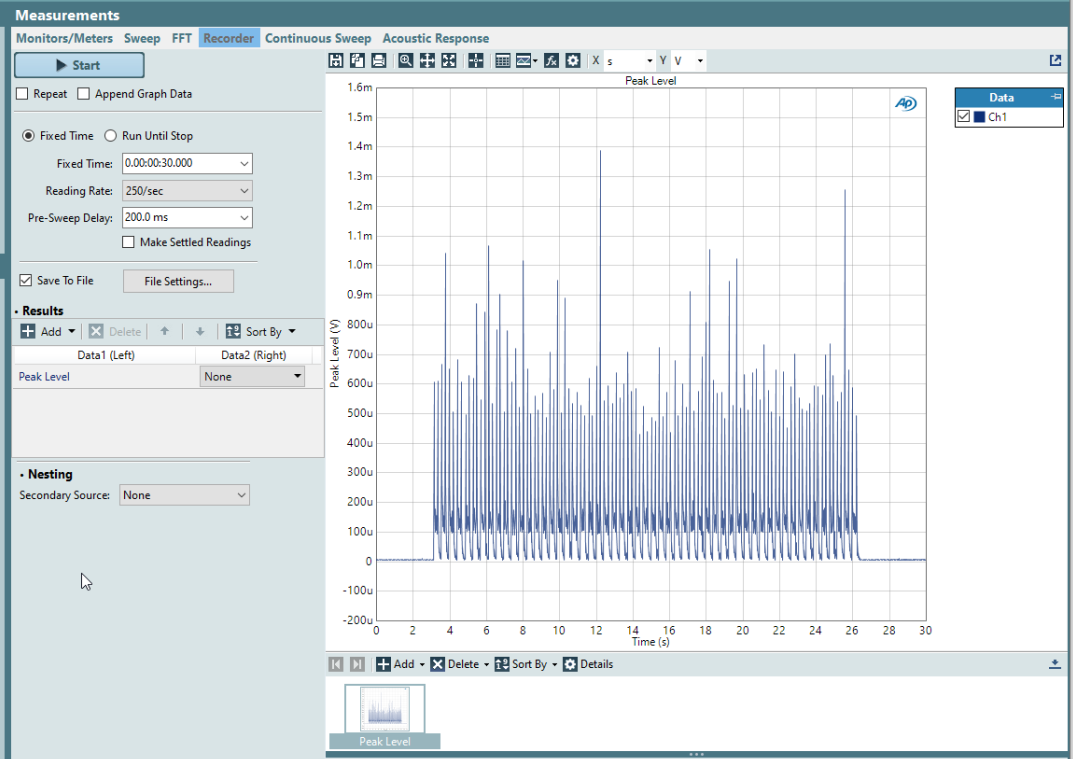
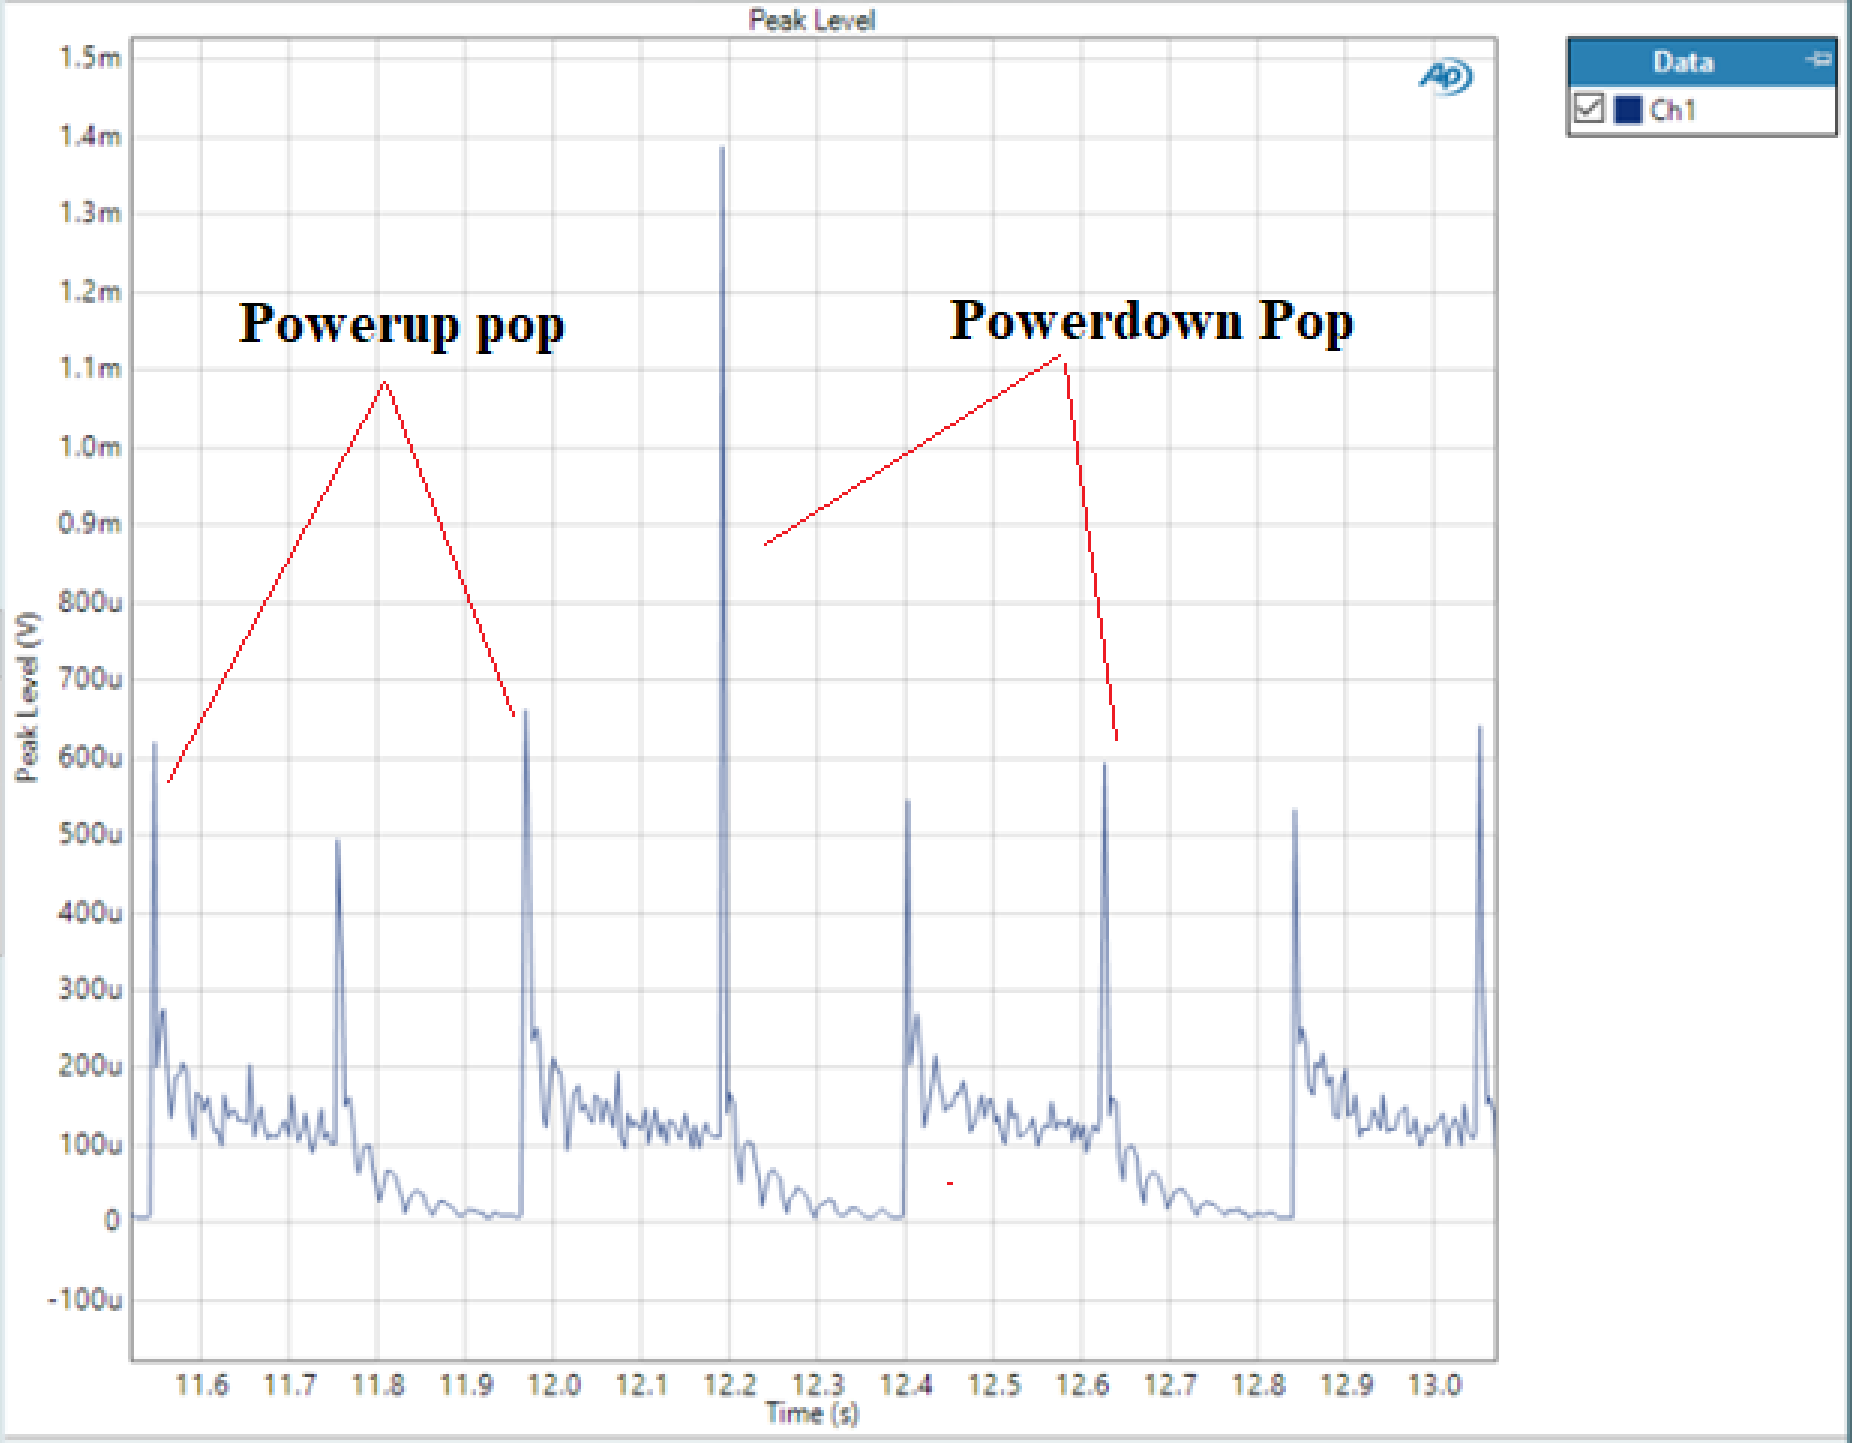
This window displays Non A-Weighted raw data at a reading rate of 250 per second. This is the maximum reading rate option available in AP. By looking at the data, we can understand that a maximum peak level of approximately 1.4mV got recorded over the complete acquisition period. Since this measurement was done by repeatedly powering up and powering down the device, every alternate pop is due to power up or power down. Post power up the amplifier output offset voltage is high pass filtered (20Hz in AP) and we observe a falling settling transient voltage from 200uV to 100uV before shutdown.
 Figure 6-11 Measurement Recorder Window –
Capture
 Figure 6-12 Measurement Recorder Window –
Zoomed Around Max. Peak Level