SWRA478D February 2015 – January 2019 CC1310 , CC1312PSIP , CC1312R , CC1314R10 , CC1352P , CC1352P7 , CC1352R , CC2640 , CC2640R2F , CC2640R2F-Q1 , CC2642R , CC2642R-Q1 , CC2650 , CC2650MODA , CC2652P , CC2652R , CC2652R7 , CC2652RB , CC2652RSIP
6.1.1 Analysis Software Setup
All measurements and analysis can be done directly with the Agilent N6705B interface, but in this application report, a PC Tool called "14585A Control and Analysis Software for Advanced Power Supplies" ( v2.0.2.1) is used to control the Agilent N6705B. The software is available from http://www.keysight.com/ (in 2014, Agilent electronics instruments division was acquired by Keysight Technologies).
When the PC Tool is started, no external equipment is connected, which is observed in the “Instrument Control Tab”, as shown in Figure 6-3.
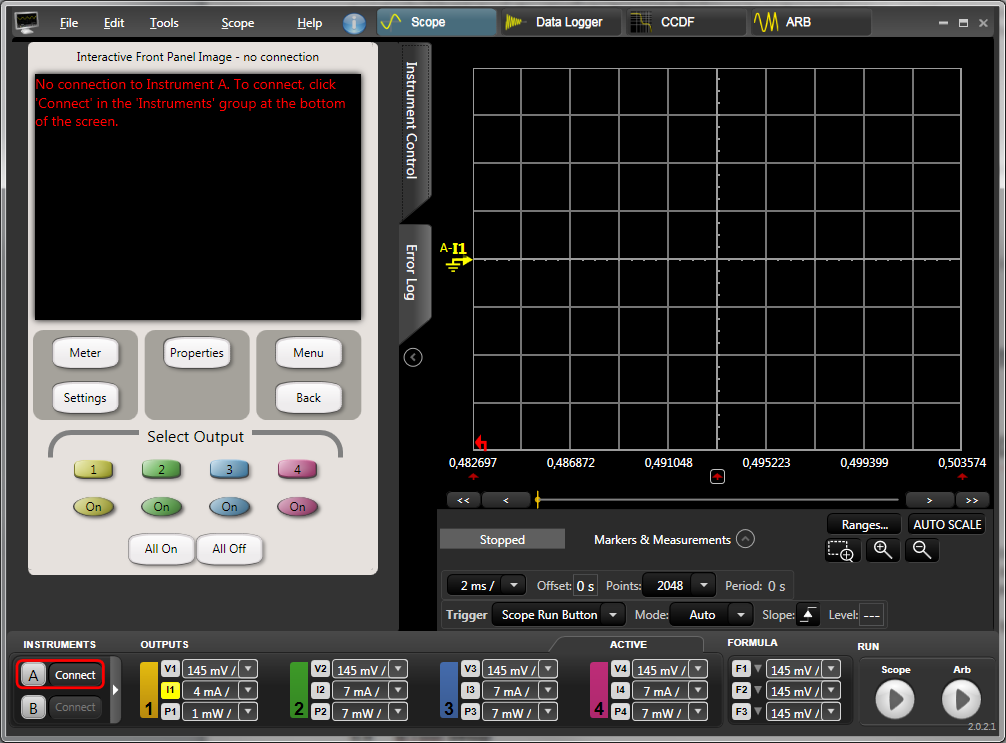 Figure 6-3 Agilent
14585A Control and Analysis Software, Start-Up
Figure 6-3 Agilent
14585A Control and Analysis Software, Start-UpTo connect the Agilent N6705B, make sure that it is connected via USB and that it is powered. Use the bottom left “Connect” button to select the connected hardware, as shown in Figure 6-4.
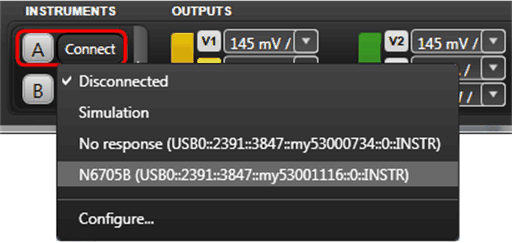 Figure 6-4 Agilent
14585A Control and Analysis Software, Connect
Figure 6-4 Agilent
14585A Control and Analysis Software, ConnectWhen the hardware has been successfully connected, it is fully controlled from the PC Tool, which is verified by the “Instrument Control” tab, as shown in Figure 6-5.
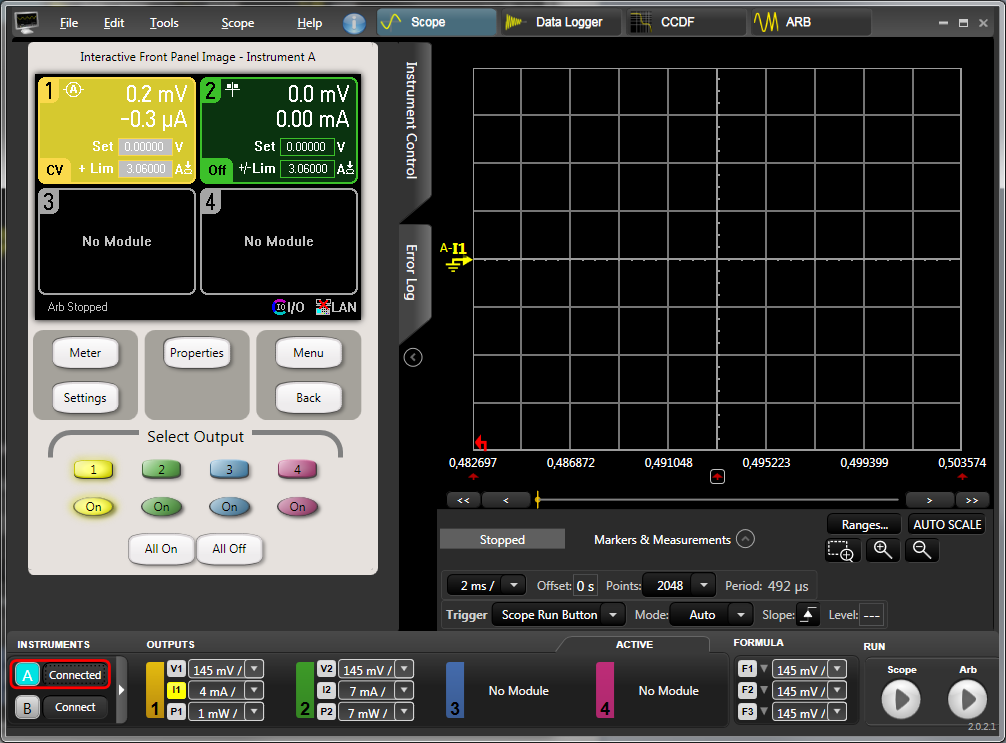 Figure 6-5 Agilent
14585A Control and Analysis Software, Connected
Figure 6-5 Agilent
14585A Control and Analysis Software, ConnectedNote that the Output may be “On” per default (observed by the lit “on” button). If so, turn the Output off since the actual output parameters have not been configured yet. The next step is to configure the output. In the “Instrument Control” tab, click the “Settings” button to bring up the Source Settings for Output 1. Depending on the module within the Agilent N6705B, the options may be limited. Select “2 Quadrant Power Supply” and set the “Voltage” to 3.0 V.
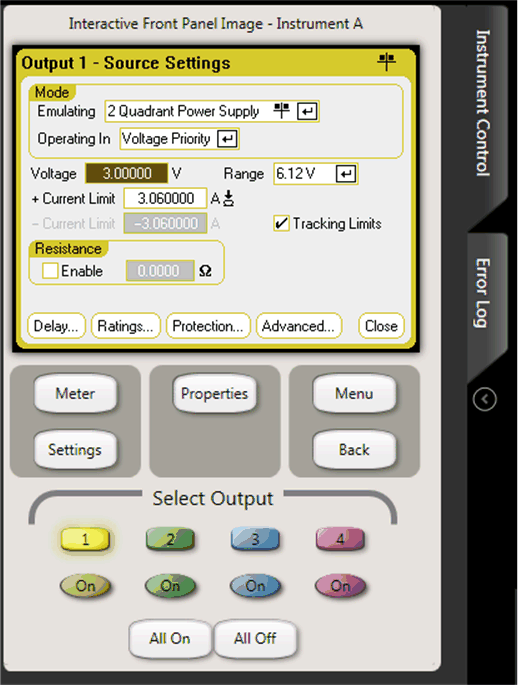 Figure 6-6 Agilent
14585A Control and Analysis Software, Source Settings
Figure 6-6 Agilent
14585A Control and Analysis Software, Source SettingsConnect the instrument probes to the DUT. For the LaunchPads, the VDD line should be connected to the 3V3 pin. The GND can be connected to any GND pin. Connecting to the CC26x2R1 LaunchPad is shown in Figure 6-7.
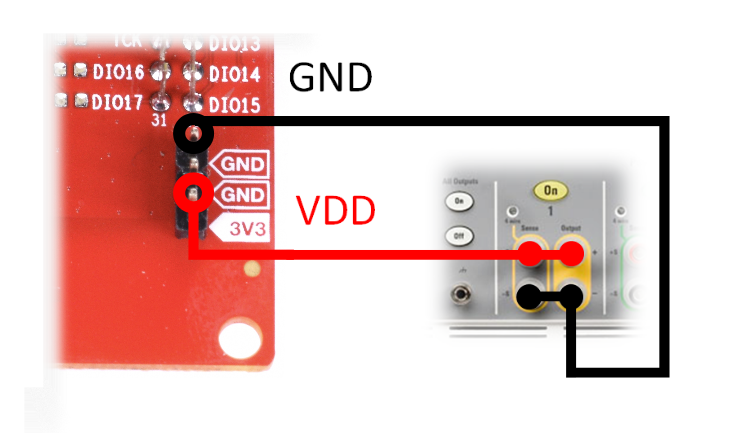 Figure 6-7 Connecting to the CC26x2r1
LaunchPad
Figure 6-7 Connecting to the CC26x2r1
LaunchPadWhen the DUT is correctly connected, the power supply is enabled by pressing the “On” button within the Agilent 14585A Control and Analysis Software. The power consumption measurements can be done by two separate functions: Scope or Data Logger. The Data Logger provides an average power consumption measurement over longer time, for example, minutes and hours, although the resolution is not as good as using Scope. This document focuses on doing measurements by using the Scope feature.
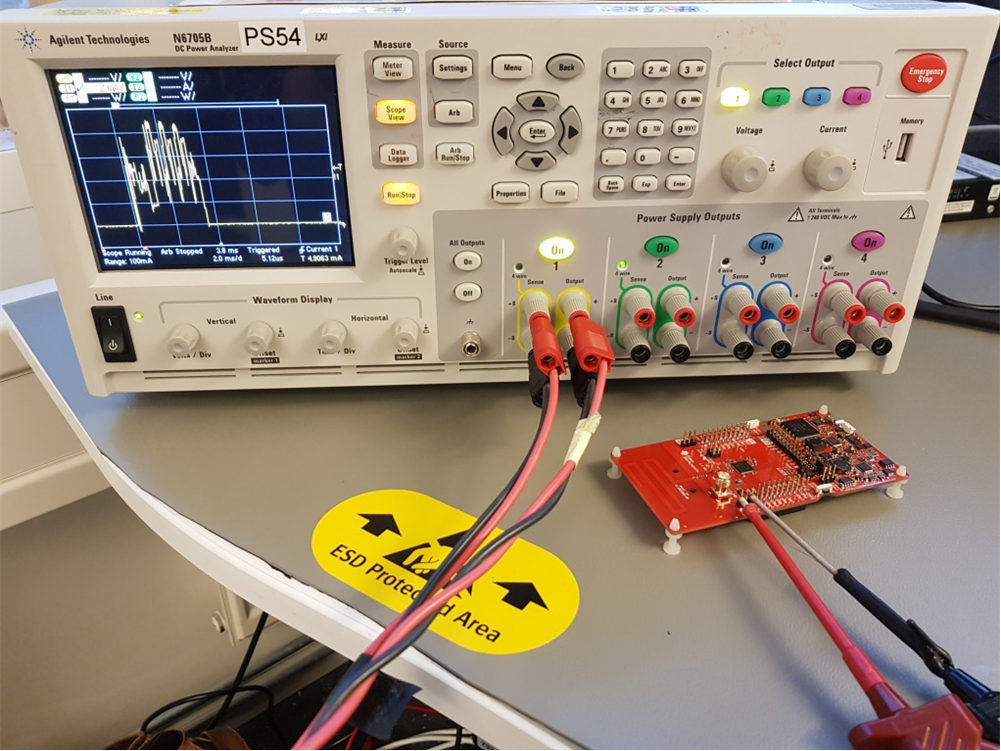 Figure 6-8 Connected
DUT to Agilent 14585A