SPRAD20 March 2022 AM2631 , AM2631-Q1 , AM2632 , AM2632-Q1 , AM2634 , AM2634-Q1
- Trademarks
- 1Introduction
-
2A Step-by-Step Guide to Running a Traction
Inverter
- 2.1 Create Real Time Debug Interface
- 2.2 Configure Control Peripheral and ADC Interrupt With Sysconfig
- 2.3 Configure Gate Driver Interface With MSPI
- 2.4 Get Samples From ADC and Read Samples Via CCS
- 2.5 Generate Space Vector PWM and Drive Motor in Open Loop
- 2.6 Close Current Loop With Mock Speed
- 2.7 Add Software Resolver to Digital Converter
- 2.8 Close Speed Loop With Rotor Speed
- 3A Brief Guide to Code Migration
- 4Summary
- 5References
2.1.3 Add Serial Command Monitor Software
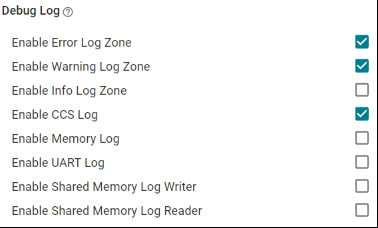
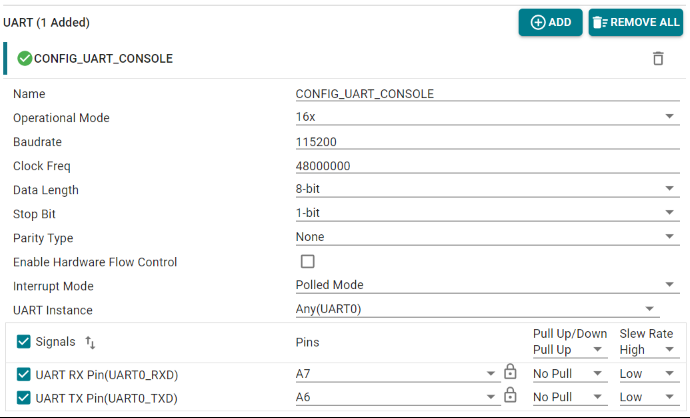
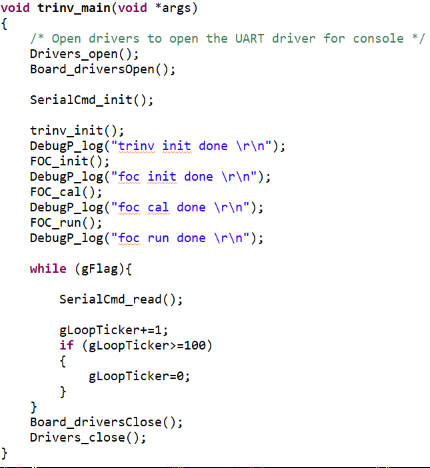
There are multiple ways to use UART0 as a debug interface. They are Debug Log and Serial Command Monitor. Debug Log is a built-in tool located at Driver Porting Layer of SDK. Like Serial Cmd Monitor, its function must be located out of interrupt callback. It is a handy tool enabling string input and output. But, input and output go through UART console only. There is no built-in GUI like Expression Window and Graph in CCS. It is recommended to disable UART0 in Debug Log at Figure 2-11 and configure UART0 instance for Serial Command Monitor at Figure 2-12. As the name of UART in Sysconfig, "CONFIG_UART_CONSOLE", matches the handle name in "Serial_Cmd_HAL.c", it not necessary to modify the two functions required by initialization and background loop. They can be simply inserted as Figure 2-13.
 Figure 2-11 Disable UART Log in Debug
Log
 Figure 2-12 Configure UART0
Instance
 Figure 2-13 Add Serial Monitor Function
Calls