SBAU362 March   2021 ADS1015 , ADS1115


  1.   Trademarks
  2. 1Introduction
  3. 2Quick Start
    1. 2.1 Step 1 - Hardware Setup
    2. 2.2 Step 2 - USB Connection and GUI Startup
    3. 2.3 Step 3 - Configuration and Data Collection
  4. 3ADS1x15EVM Overview
    1. 3.1 ADS1x15EVM-to-PAMBoard Interface
    2. 3.2 Digital Interface
    3. 3.3 Analog Input Connections
    4. 3.4 Power-Supply Options
  5. 4ADS1x15V2EVM-PDK Setup and Operation
    1. 4.1 EVM Plug-In Instructions
    2. 4.2 ADS1x15EVM GUI and TI Cloud Agent Installation
  6. 5ADS1x15V2EVM-PDK GUI
    1. 5.1 Menu Bar
      1. 5.1.1 File Menu
      2. 5.1.2 Options Menu
      3. 5.1.3 Tools Menu
      4. 5.1.4 Help Menu
    2. 5.2 Navigation Bar
      1. 5.2.1 Home
      2. 5.2.2 Chart
        1. 5.2.2.1 Channel Statistics
          1. 5.2.2.1.1 Time Domain and Histogram Statistics
          2. 5.2.2.1.2 FFT Statistics
        2. 5.2.2.2 Time Domain Plot
        3. 5.2.2.3 Histogram Plot
        4. 5.2.2.4 FFT Plot
        5. 5.2.2.5 Capture Configuration Settings
      3. 5.2.3 Configuration
        1. 5.2.3.1 Register Read and Write Options
          1. 5.2.3.1.1 Read Register Options
          2. 5.2.3.1.2 Write Register Options
    3. 5.3 Connection Status
  7. 6Bill of Materials, Printed Circuit Board Layout, and Schematics
    1. 6.1 Bill of Materials
    2. 6.2 Printed Circuit Board Layout
    3. 6.3 Schematics

Step 3 - Configuration and Data Collection

When the GUI has recognized the EVM, go to the chart window as identified in Figure 2-2.

  1. Select the Chart icon on the left side of the GUI. Open the slide-out configuation from the right side of the GUI and Show Capture Settings. Select the MUX input for AINP = AIN0 and AINN = GND from the Select MUX Channels drop-down menu selection.
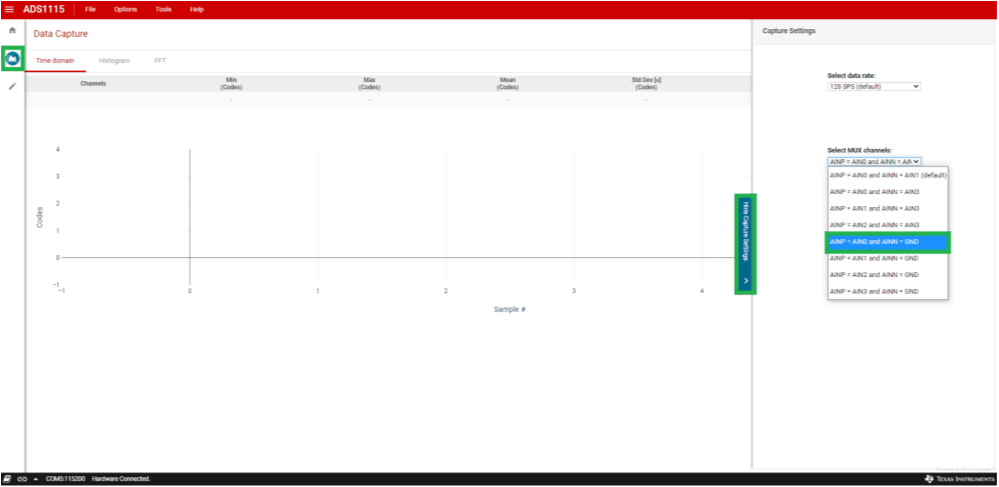
    GUID-20210312-CA0I-XKX1-V59W-BMPB7D1PNMXT-low.gif Figure 2-2 Capture Setting - MUX.
  2. Select FSR = ±4.096V from the Select FSR drop-down menu as shown in Figure 2-3. The selection is needed to increase the full-scale range to measure the 3.3-V input.
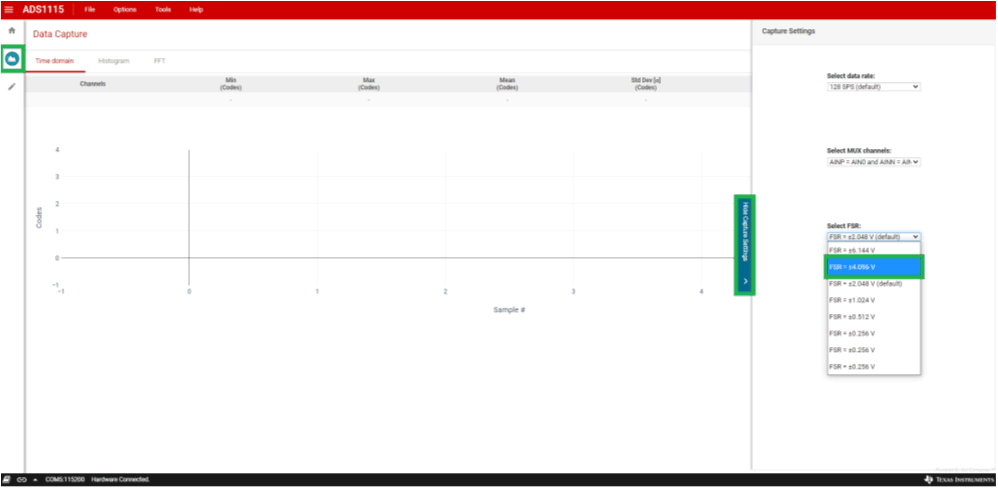
    GUID-20210312-CA0I-WM3F-H90T-GQVXQ0BR7NG2-low.gif Figure 2-3 Capture Setting - Full-Scale Range (FSR).
  3. Close the slide-out configuration window by selecting Hide Capture Settings.
  4. Choose Volts from the chart window for the Y-axis drop-down menu. See Figure 2-4.
  5. Press the COLLECT DATA button to capture the data.
  6. The collected data appears in the chart window when the collection completes.
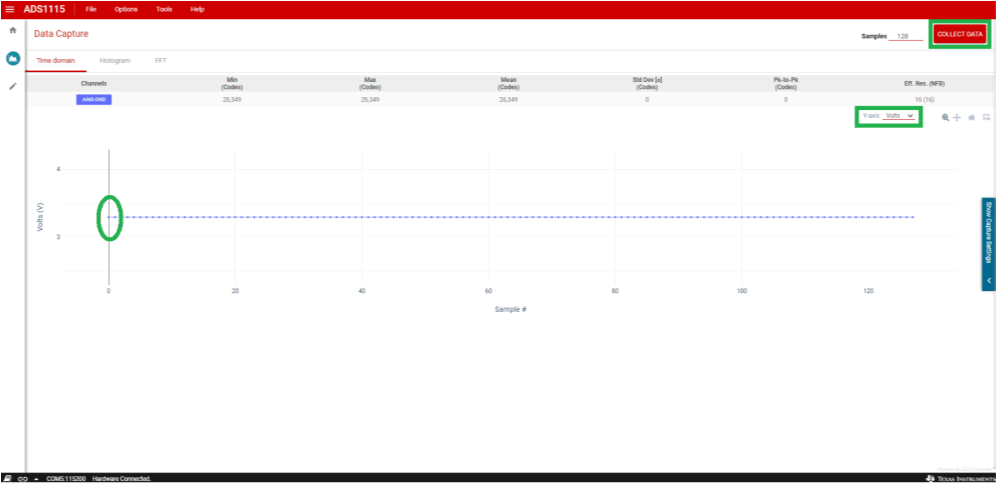
    GUID-20210312-CA0I-SBP2-LCB0-5GT3GTDLVKKT-low.gif Figure 2-4 Data Capture.