SBAU362 March   2021 ADS1015 , ADS1115


  1.   Trademarks
  2. 1Introduction
  3. 2Quick Start
    1. 2.1 Step 1 - Hardware Setup
    2. 2.2 Step 2 - USB Connection and GUI Startup
    3. 2.3 Step 3 - Configuration and Data Collection
  4. 3ADS1x15EVM Overview
    1. 3.1 ADS1x15EVM-to-PAMBoard Interface
    2. 3.2 Digital Interface
    3. 3.3 Analog Input Connections
    4. 3.4 Power-Supply Options
  5. 4ADS1x15V2EVM-PDK Setup and Operation
    1. 4.1 EVM Plug-In Instructions
    2. 4.2 ADS1x15EVM GUI and TI Cloud Agent Installation
  6. 5ADS1x15V2EVM-PDK GUI
    1. 5.1 Menu Bar
      1. 5.1.1 File Menu
      2. 5.1.2 Options Menu
      3. 5.1.3 Tools Menu
      4. 5.1.4 Help Menu
    2. 5.2 Navigation Bar
      1. 5.2.1 Home
      2. 5.2.2 Chart
        1. 5.2.2.1 Channel Statistics
          1. 5.2.2.1.1 Time Domain and Histogram Statistics
          2. 5.2.2.1.2 FFT Statistics
        2. 5.2.2.2 Time Domain Plot
        3. 5.2.2.3 Histogram Plot
        4. 5.2.2.4 FFT Plot
        5. 5.2.2.5 Capture Configuration Settings
      3. 5.2.3 Configuration
        1. 5.2.3.1 Register Read and Write Options
          1. 5.2.3.1.1 Read Register Options
          2. 5.2.3.1.2 Write Register Options
    3. 5.3 Connection Status
  7. 6Bill of Materials, Printed Circuit Board Layout, and Schematics
    1. 6.1 Bill of Materials
    2. 6.2 Printed Circuit Board Layout
    3. 6.3 Schematics
Time Domain and Histogram Statistics

As depicted in Figure 5-15, the Time Domain and Histogram plots share the same statistical information:

  • Input Channels selected
  • Min code within the data set
  • Max code within the data set
  • Mean code value within the data set
  • Std Dev representing the standard deviation within the data set
  • Pk-to-Pk representing the total noise peak-to-peak within the data set
  • Eff. Res representing the effective resolution as number of bits with the value in parenthesis showing the noise-free number of bits
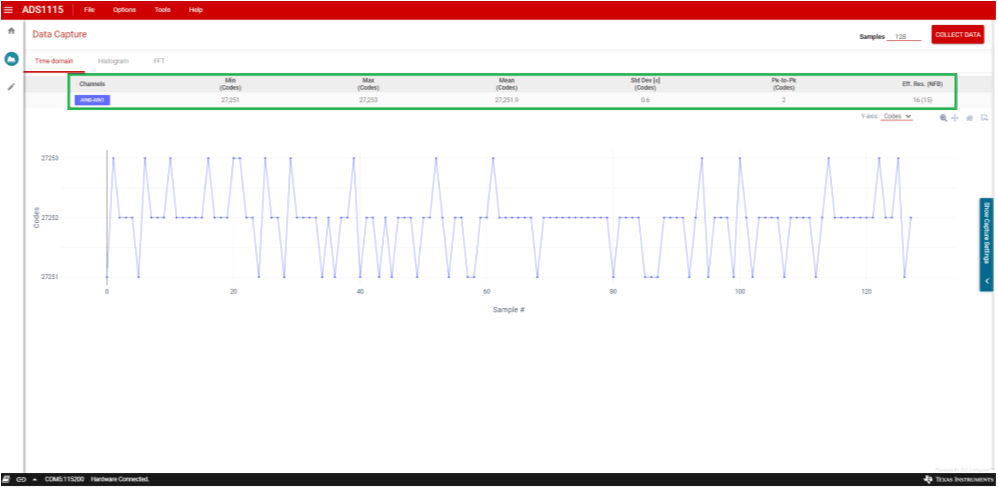
GUID-20210317-CA0I-3CQ5-KWBH-29XL2D34NFJH-low.gifFigure 5-15 Capture Statistics