SPRUIK4A September 2018 – June 2019 TMS320F280021 , TMS320F280021-Q1 , TMS320F280023 , TMS320F280023-Q1 , TMS320F280023C , TMS320F280025 , TMS320F280025-Q1 , TMS320F280025C , TMS320F280025C-Q1 , TMS320F280040-Q1 , TMS320F280040C-Q1 , TMS320F280041 , TMS320F280041-Q1 , TMS320F280041C , TMS320F280041C-Q1 , TMS320F280045 , TMS320F280048-Q1 , TMS320F280048C-Q1 , TMS320F280049 , TMS320F280049-Q1 , TMS320F280049C , TMS320F280049C-Q1 , TMS320F28075 , TMS320F28075-Q1 , TMS320F28076 , TMS320F28374D , TMS320F28374S , TMS320F28375D , TMS320F28375S , TMS320F28375S-Q1 , TMS320F28376D , TMS320F28376S , TMS320F28377D , TMS320F28377D-Q1 , TMS320F28377S , TMS320F28377S-Q1 , TMS320F28378D , TMS320F28378S , TMS320F28379D , TMS320F28379D-Q1 , TMS320F28379S
-
C2000 Software Frequency Response Analyzer (SFRA) Library and Compensation Designer in SDK Framework
- Trademarks
- 1 Introduction
- 2 Installing the SFRA Library
- 3 Module Summary
- 4 Compensation Designer
- 5 Case Study
- 6 Running Software Test Bench Example for SFRA
- 7 Using SFRA Without SFRA GUI Integration
- 8 FAQ
- Revision History
6 Running Software Test Bench Example for SFRA
The SFRA library comes with a software test bench (STB) example that runs the SFRA around a fictitious loop that consists of a proportional integral controller, inherently due to the sampled nature of SFRA the digital update delay, as shown in Figure 17.
 Figure 17. Software Test Bench Example
 To import the STB project:
- Open CCS and click on Project tab and click on Import CCS Project. In the window that pops up, browse to the SFRA install directory under examples <sfra_install>/examples/ccs. All of the available example projects will be displayed. Click "Finish" and the project will be copied into your workspace.
- Make sure the correct control card is connected to the host machine. That is, for the F28004x STB project, an F28004x control card must be connected to the machine. Compile and load the project, and run the project.
- Open the SFRA GUI.exe as outlined in the section Section 5.1. Once the SFRA GUI is connected , start a sweep. Once finished the SFRA will display under open loop curve the plot for a simple PI compensator as shown in Figure 18 and the frequency response of a digital delay in the plant curve as shown in Figure 19.
- These are then compared with the frequency responses by simulating the same PI compensator in a simulation tool, such as MATLAB. This script is available along with the STB example 1 run data under the scripts folder in SFRA install directory. The file is called "STAB_Data_Compare_with_model.m". The comparison plots for plant is shown in Figure 20, and comparison for open loop is shown in Figure 21.
- The small errors in the measured and modeled frequency responses are not clear from the above plots. Hence, a zoomed view of the open loop plot for the STB example 1 is shown in Figure 22.
NOTE
The STB example can run the single precision floating point lib and the single precision floating point lib with tmu. A selection can be made while importing the project
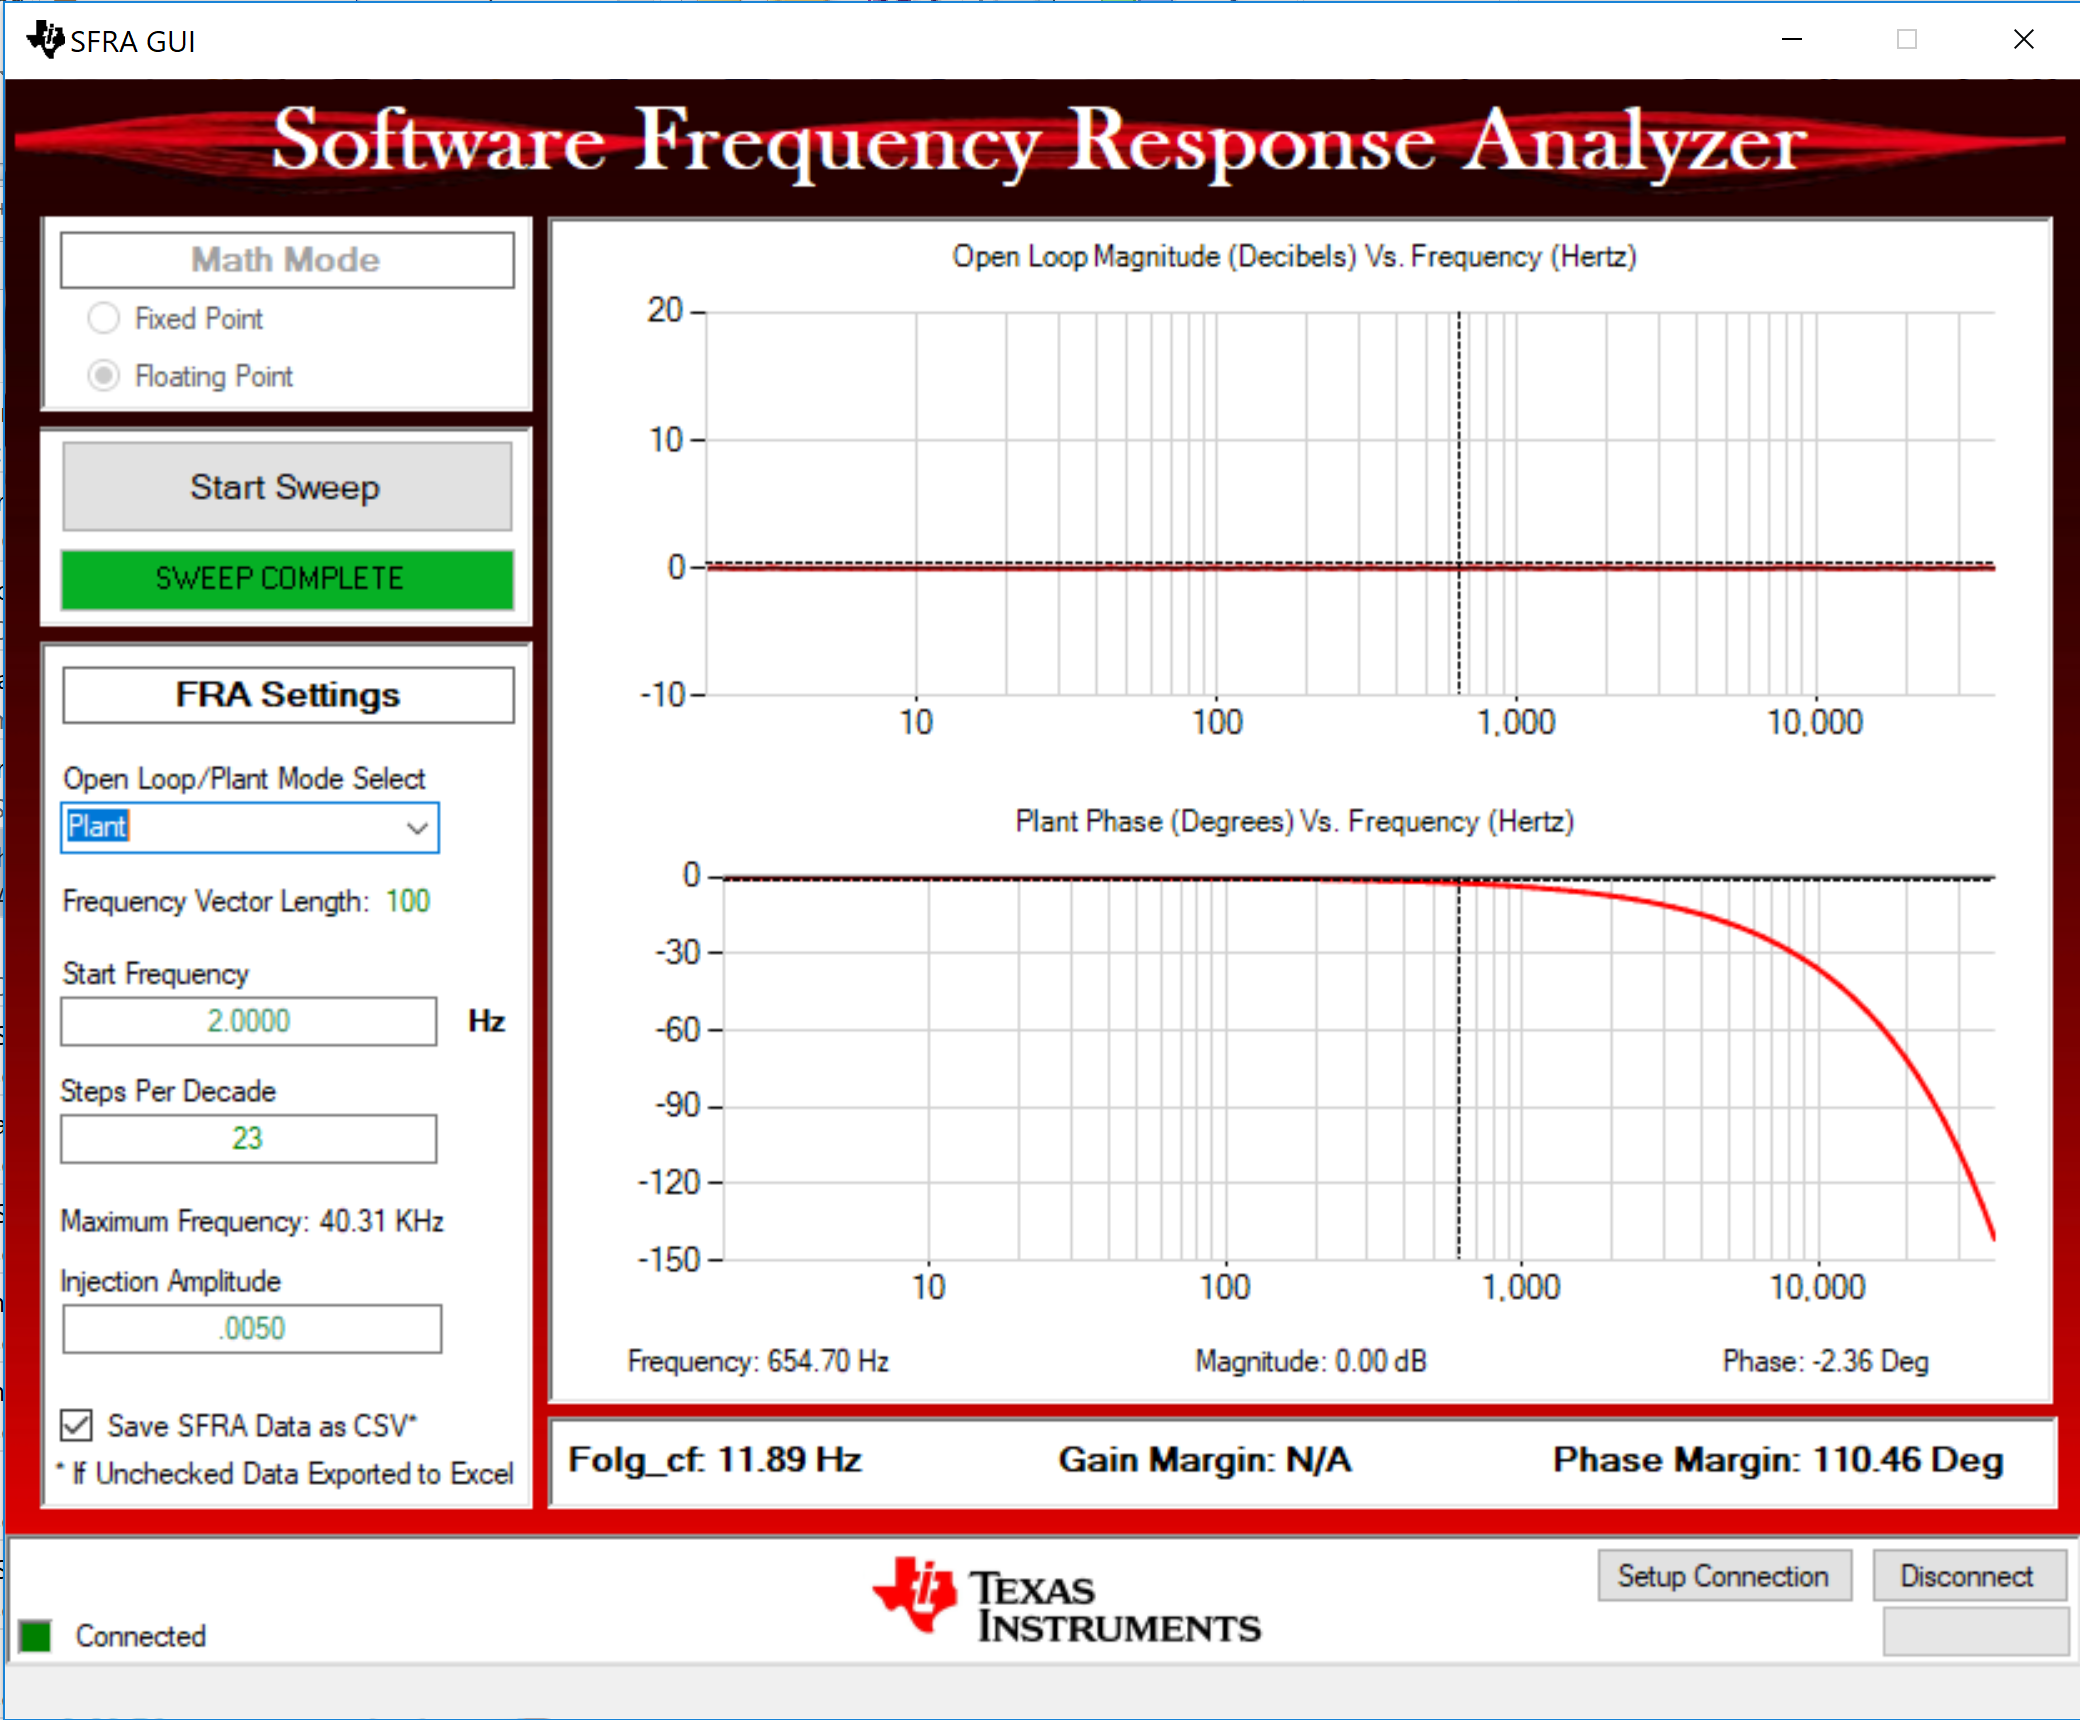 Figure 18. SFRA Plot for the Plant, After STB Example 1 Run
 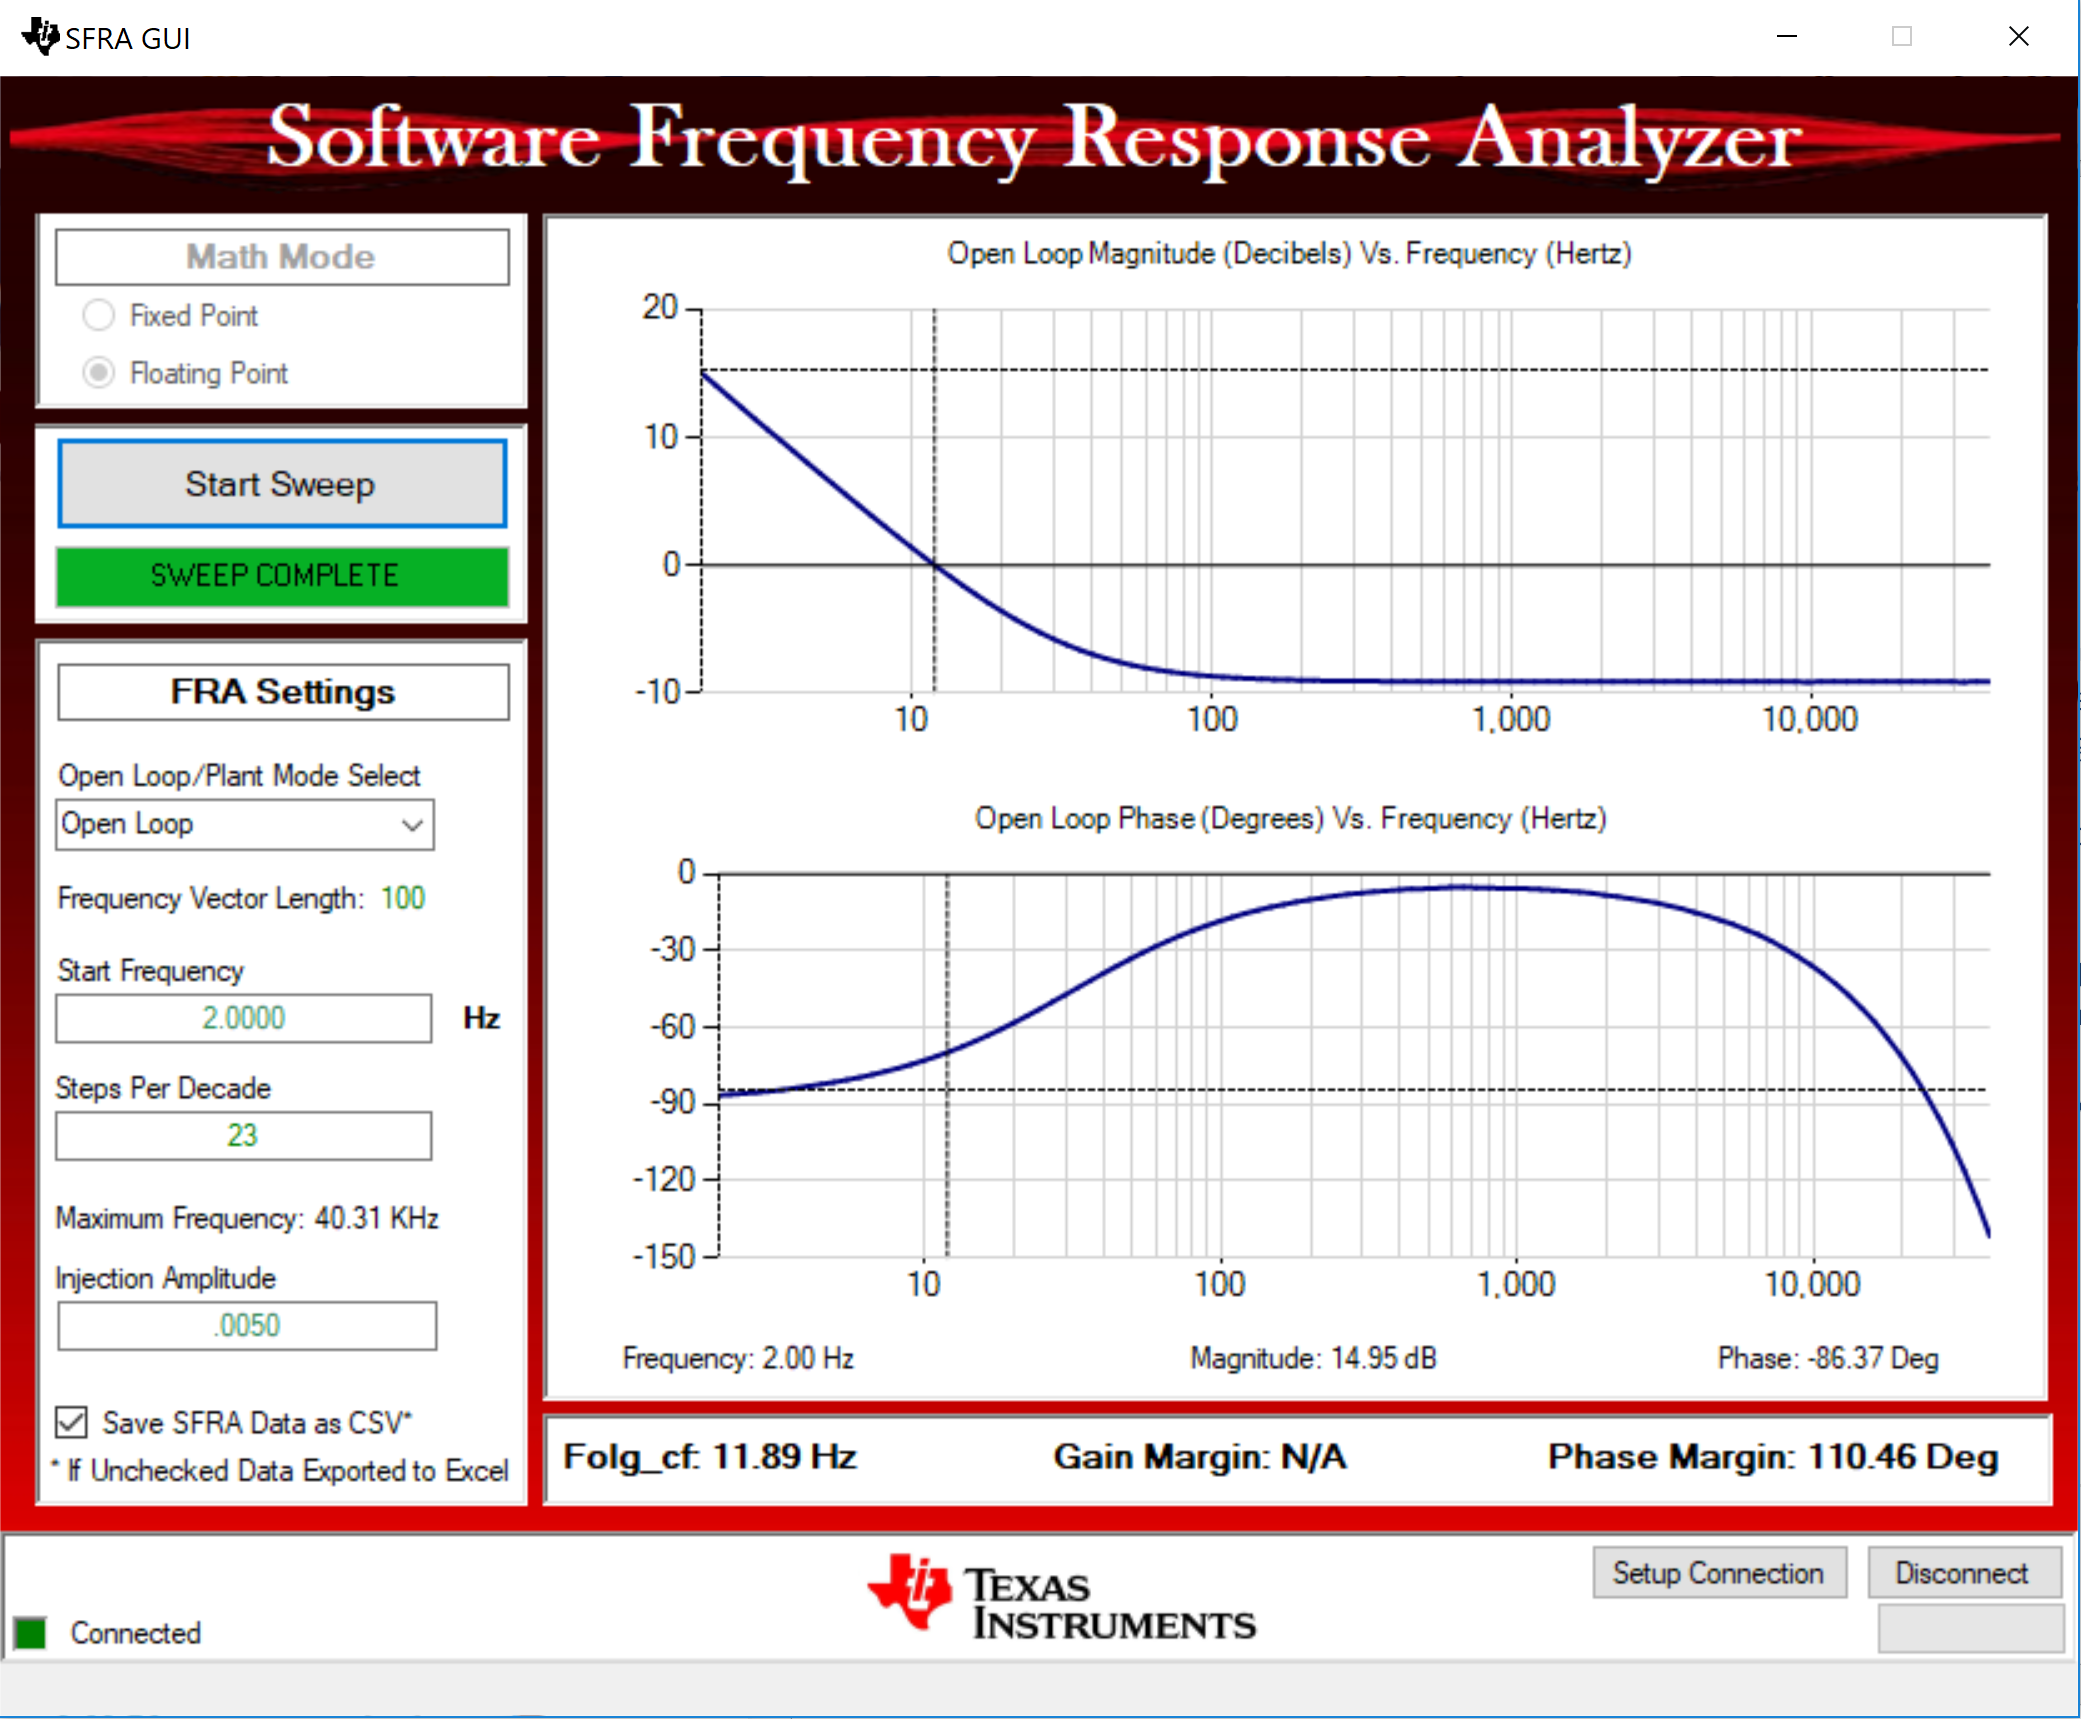 Figure 19. SFRA Plot for Open Loop After STB Example 1 Run
 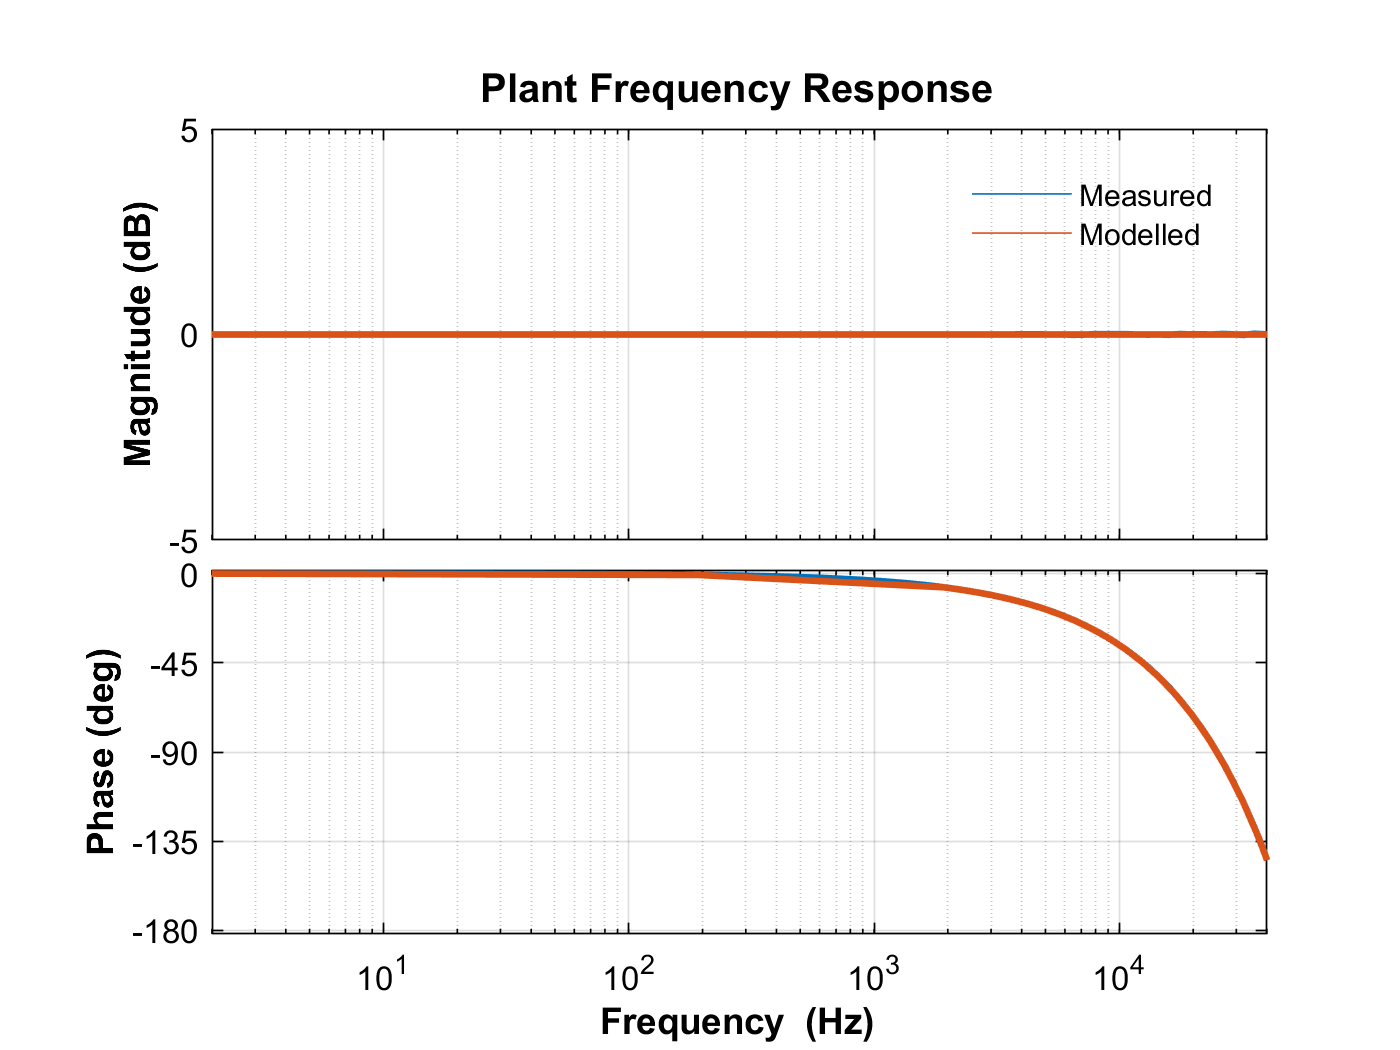 Figure 20. Plant Frequency Response Measured vs Modeled in Software Test Bench Example 1
 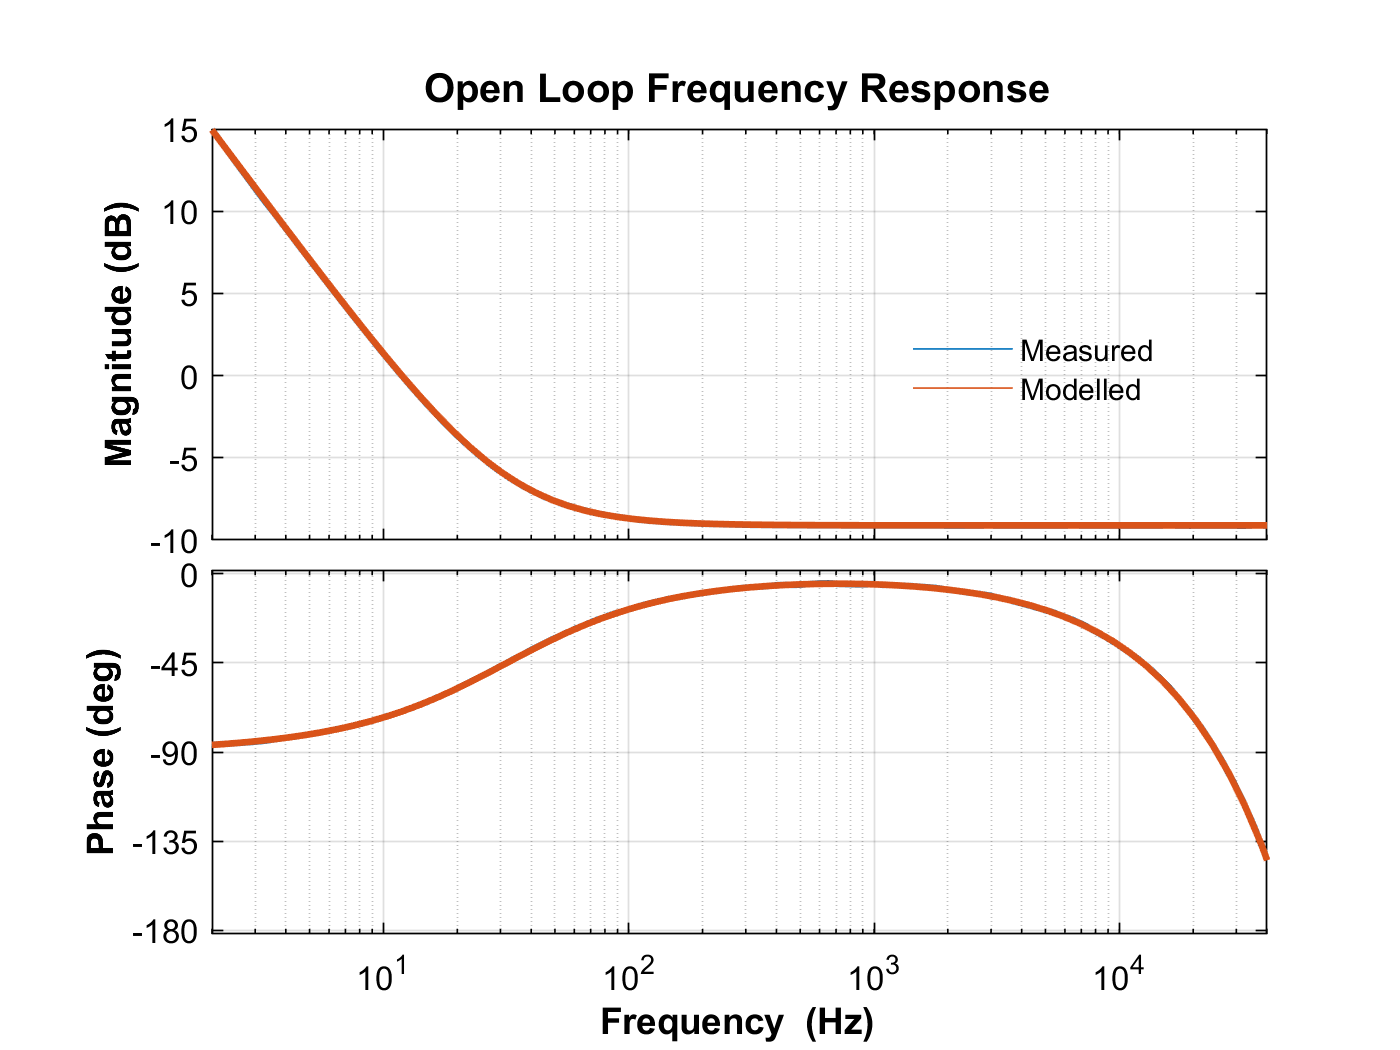 Figure 21. Open Loop Frequency Response Measured vs Modeled for Software Test Bench Example
 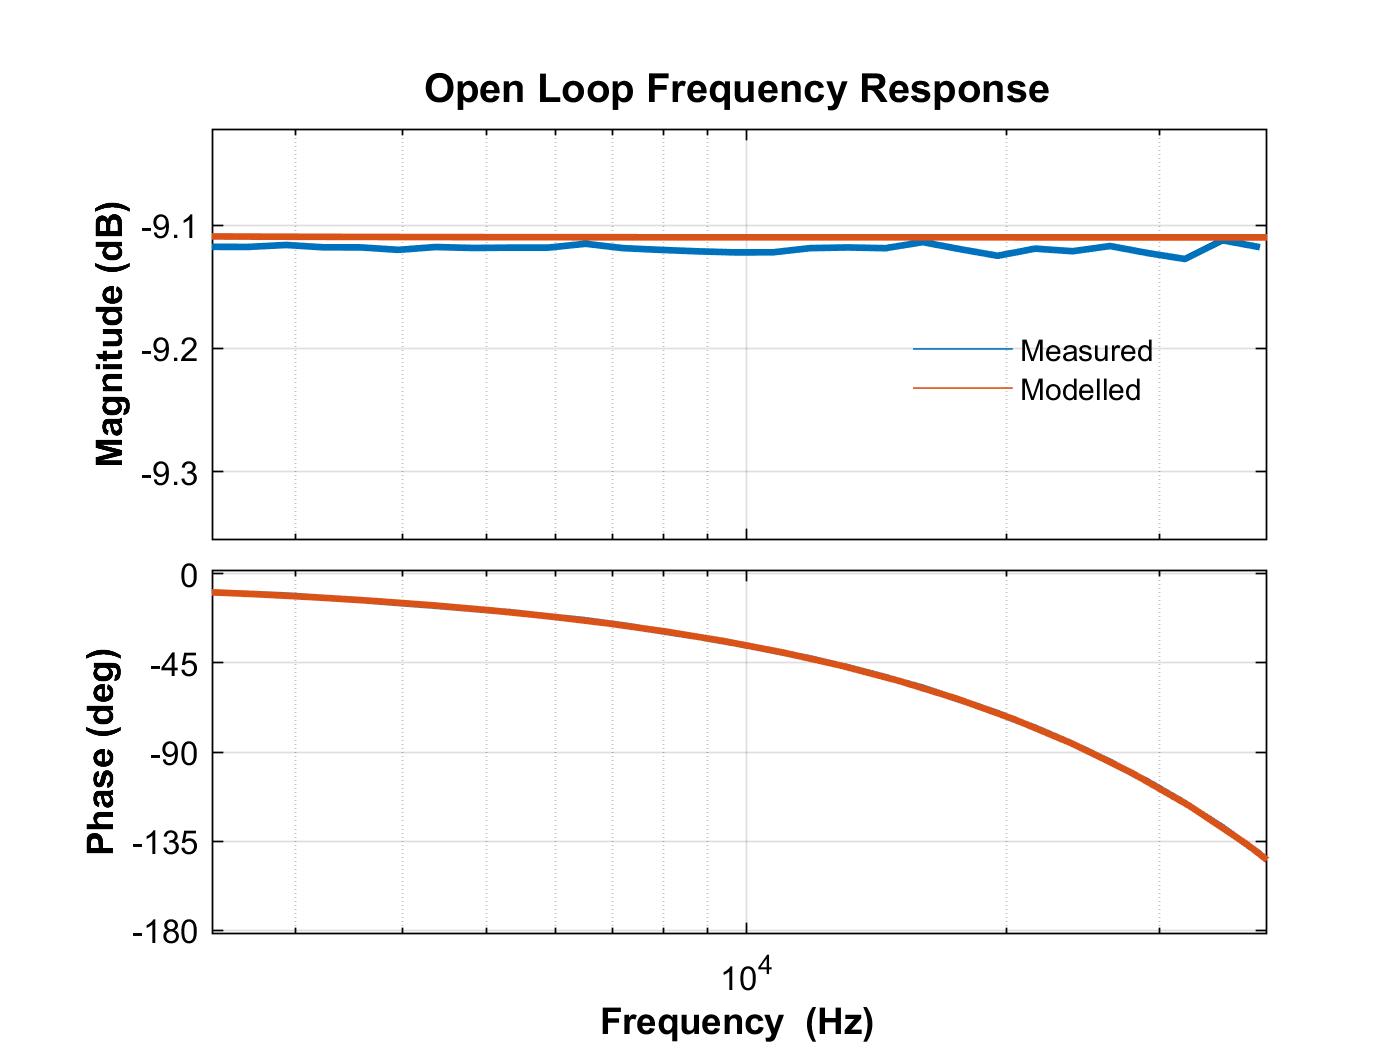 Figure 22. Zoomed in Open Loop Frequency Response for STB Example 1, Measured vs Modeled Comparison
 There are some errors that are caused by floating-point operations and how they are handled on the MCU, and how matlab handles them. Overall, this verifies the SFRA algorithm function as the errors are within reasonable error limits. Closed loop transfer function plot can also be verified in a similar manner.