SPRUIQ5 May 2019 TMS320F280021 , TMS320F280021-Q1 , TMS320F280023 , TMS320F280023-Q1 , TMS320F280023C , TMS320F280025 , TMS320F280025-Q1 , TMS320F280025C , TMS320F280025C-Q1 , TMS320F280040-Q1 , TMS320F280040C-Q1 , TMS320F280041 , TMS320F280041-Q1 , TMS320F280041C , TMS320F280041C-Q1 , TMS320F280045 , TMS320F280048-Q1 , TMS320F280048C-Q1 , TMS320F280049 , TMS320F280049-Q1 , TMS320F280049C , TMS320F280049C-Q1 , TMS320F28374D , TMS320F28374S , TMS320F28375D , TMS320F28375S , TMS320F28375S-Q1 , TMS320F28376D , TMS320F28376S , TMS320F28377D , TMS320F28377D-EP , TMS320F28377D-Q1 , TMS320F28377S , TMS320F28377S-Q1 , TMS320F28378D , TMS320F28378S , TMS320F28379D , TMS320F28379D-Q1 , TMS320F28379S
3.5 Setting Up the Watch Window and Graphs
- Click View.
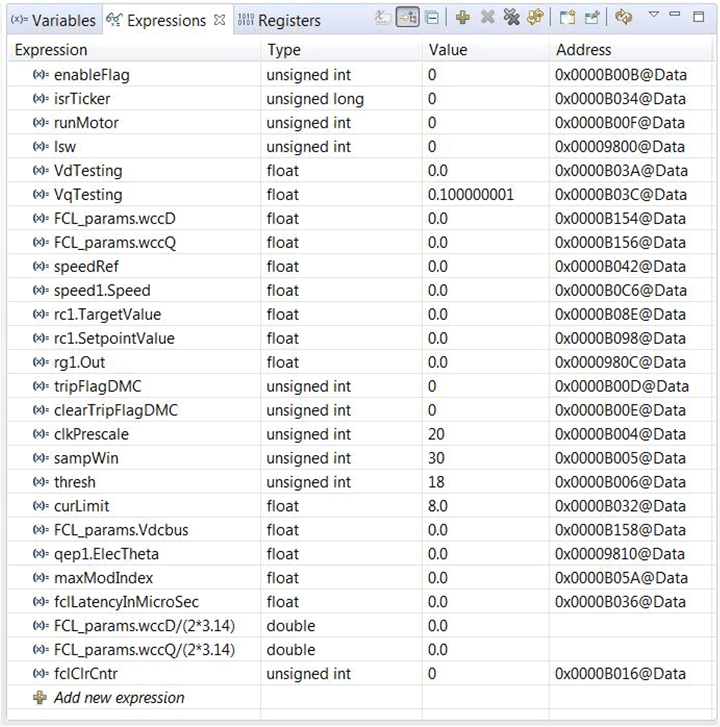
- To open a watch window to view the variables used in the project, click Expressions on the menu bar.
- Add variables to the watch window (see Figure 3-6).
- To select a number format for the variable, do the following:
- Right-click the variable.
- Choose the format (see Figure 3-6).
- Alternately, you can import a group of variables into the Expressions window by doing the following:
- Right-click in the Expressions window.
- Click Import.
- Navigate to the debug directory of the projectC:\ti\c2000\C2000Ware_MotorControl_SDK_1_00_00_00\solutions\tmdxiddk379d\f2837x\debug
- select fcl_f2837x_tmdxiddk_vars.txt file containing the list of variables.
- Click OK to import the variables. (See Figure 3-6.)
- Click
 (Continuous Refresh) in the watch window.
 - Alternatively, you can import graph configurations files in the project folder by doing the following:
- Click Tools.
- Click Graph.
- Click DualTime...
- Click Import.
- Browse to C:\ti\c2000\C2000Ware_MotorControl_SDK_1_00_00_00\solutions\tmdxiddk379d\f2837x\debug
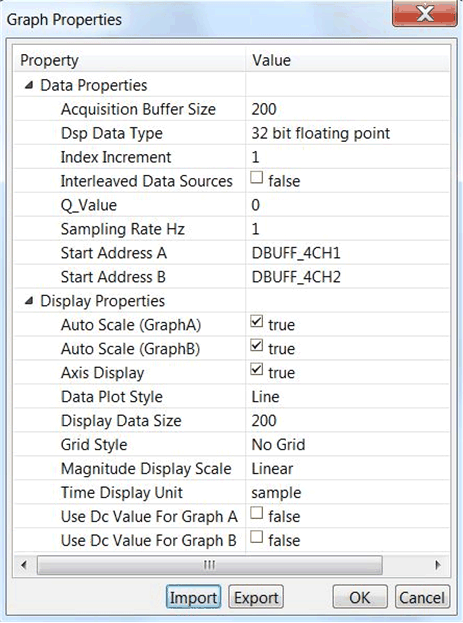
- Select fcl_f2837x_tmdxiddk_graph1.graphProp. (The Graph Properties window should look like Figure 3-7.)
- Click OK to add graphs to your debug perspective.
- Click
 (Continuous Refresh).
NOTE
If using a second graph window, import fcl_f2837x_tmdxiddk_graph2.prop (the beginning address for this should be DBUFF_4CH3 and DBUFF_4CH4).
The default dlog.prescaler is set to 5, which lets the dlog function to only log one out of every five samples.
Set the default dlog.trig_value to the correct value to generate trigger for the plot similar to using an oscilloscope within a debug environment.
NOTE
The watch window uses the same number format with which the variable is declared.
 Figure 3-6 Configuring the Expressions Window
 NOTE
This action enables the window to run with real-time mode. If you click the down arrow in this watch window, you can select Customize Continuous Refresh Interval and edit the refresh rate of the watch window. Choosing an interval that is too fast can affect performance.
The datalog buffers point to different system variables depending on the build level. The buffers let you inspect the variables and judge the performance of the system. Figure 3-7 shows open and setup time graph windows to plot the data log buffers.
 Figure 3-7 Graph Window Settings