SPRAD28 October   2022 AM2431 , AM2432 , AM2434 , AM2631 , AM2631-Q1 , AM2632 , AM2632-Q1 , AM2634 , AM2634-Q1 , AM26C31 , AM26C31-EP , AM26C31C , AM26C31I , AM26C31M , AM26C32 , AM26C32-EP , AM26C32C , AM26C32M , AM26LS31 , AM26LS31M , AM26LS32A , AM26LS32AC , AM26LS32AM , AM26LS33A , AM26LS33A-SP , AM26LS33AM , AM26LV31 , AM26LV31E , AM26LV31E-EP , AM26LV32 , AM26LV32E , AM26LV32E-EP , AM26S10 , AM2732 , AM2732-Q1


  1.   Abstract
  2.   Trademarks
  3. Building for Debug
    1. 1.1 Disable Code Optimization
    2. 1.2 Using the Debug SDK Libraries
  4. Code Composer Studio Stop-Mode Debugging
    1. 2.1 Configuring the Debugger
    2. 2.2 Breakpoints and Watchpoints
      1. 2.2.1 Software Breakpoints
      2. 2.2.2 Hardware Breakpoints
      3. 2.2.3 Watchpoints
    3. 2.3 Inspecting Device Registers
    4. 2.4 Inspecting Disassembly
  5. Debug Logging
    1. 3.1 Logging Methods
    2. 3.2 Log Zones
    3. 3.3 Asserts
    4. 3.4 Example Usage
  6. Multi-Core Debug
    1. 4.1 Grouping Cores
      1. 4.1.1 Fixed Group
      2. 4.1.2 Hiding Cores
    2. 4.2 Using Multiple Workbench Windows
    3. 4.3 Global Breakpoints
  7. Debugging Arm Cortex-R5 Exceptions
    1. 5.1 Exception Priority Order
    2. 5.2 Aborts
      1. 5.2.1 Data Aborts
        1. 5.2.1.1 Alignment
        2. 5.2.1.2 Background Aborts
        3. 5.2.1.3 Permission
        4. 5.2.1.4 Synchronous/Asynchronous External
        5. 5.2.1.5 Synchronous/Asynchronous ECC
      2. 5.2.2 Synchronous/Asynchronous Aborts
        1. 5.2.2.1 Changing an Asynchronous Abort to a Synchronous Abort
        2. 5.2.2.2 Synchronous Abort
        3. 5.2.2.3 Asynchronous Abort
        4. 5.2.2.4 Debugging Asynchronous Abort
      3. 5.2.3 Prefetch Abort
        1. 5.2.3.1 Possible Reasons for Prefetch Abort
        2. 5.2.3.2 Handling Prefetch Abort Exception
      4. 5.2.4 Undefined Instruction
        1. 5.2.4.1 Possible Reasons for Undefined Instruction Exception
        2. 5.2.4.2 Handling Undefined Instruction Exception
    3. 5.3 Fetching Core Registers Inside an Abort Handler
  8. Debugging Arm Cortex-M4 Exceptions
    1. 6.1 Exception Entry and Exit Sequence
      1. 6.1.1 Entry Sequence
      2. 6.1.2 Exception Exit Sequence
      3. 6.1.3 Decoding EXC_RETURN Value
    2. 6.2 Faults Handling
      1. 6.2.1 There are 15 System Exceptions by Arm Cortex M Processors
        1. 6.2.1.1 Causes of Faults
      2. 6.2.2 HardFault Exception
        1. 6.2.2.1 Causes of HardFault Exception
      3. 6.2.3 Configurable Fault Exceptions
        1. 6.2.3.1 Mem Manage Fault Exception
        2. 6.2.3.2 BusFault Exception
        3. 6.2.3.3 Usage Fault Exception
      4. 6.2.4 Control Registers
        1. 6.2.4.1 SHP - System Handler Priority Register
      5. 6.2.5 Status Registers
        1. 6.2.5.1 Undefined Instruction Handling Example
        2. 6.2.5.2 Invalid State Handling Example
      6. 6.2.6 Printing the Stack Frame
  9. Debugging Memory
    1. 7.1 Viewing Device Memory
    2. 7.2 Linker Command File (linker.cmd)
      1. 7.2.1 The Memory Directive
      2. 7.2.2 The Sections Directive
    3. 7.3 Stack Overflow
      1. 7.3.1 -fstack-protector
      2. 7.3.2 -fstack-protector-strong
      3. 7.3.3 -fstack-protector-all
      4. 7.3.4 Enabling Stack Smashing Detection
      5. 7.3.5 Enabling Stack Smashing Detection
    4. 7.4 Variables and Expressions View in CCS
    5. 7.5 Understanding Your Application's Memory Allocation
    6. 7.6 FreeRTOS ROV
  10. Debugging Boot
    1. 8.1 ROM Boot
    2. 8.2 SBL Boot
    3. 8.3 GEL Files
      1. 8.3.1 Debugging Init Code
        1. 8.3.1.1 Disable Auto-Run to Main
  11. Debugging Real-Time Control Loops
    1. 9.1 Trace
      1. 9.1.1 Processor / Core Trace
      2. 9.1.2 How to Use CCS to Capture Trace Data on an AM243x
    2. 9.2 Code Profile / Coverage
      1. 9.2.1 CCS Count Event
    3. 9.3 Real-Time UART Monitor
      1. 9.3.1 Confirm CCS Features
      2. 9.3.2 Create Target Configuration File
      3. 9.3.3 Add Serial Command Monitor Software
      4. 9.3.4 Launch Real Time Debug
  12. 10E2E Support Forums

Understanding Your Application's Memory Allocation

The Memory Allocation View in Code Composer Studio provides a graphical representation of how much memory is consumed by your application.

To open the view, go to the CCS menu View -> Memory Allocation.

GUID-20220325-SS0I-NVJK-FNBF-DJWPZRHNKFLC-low.png

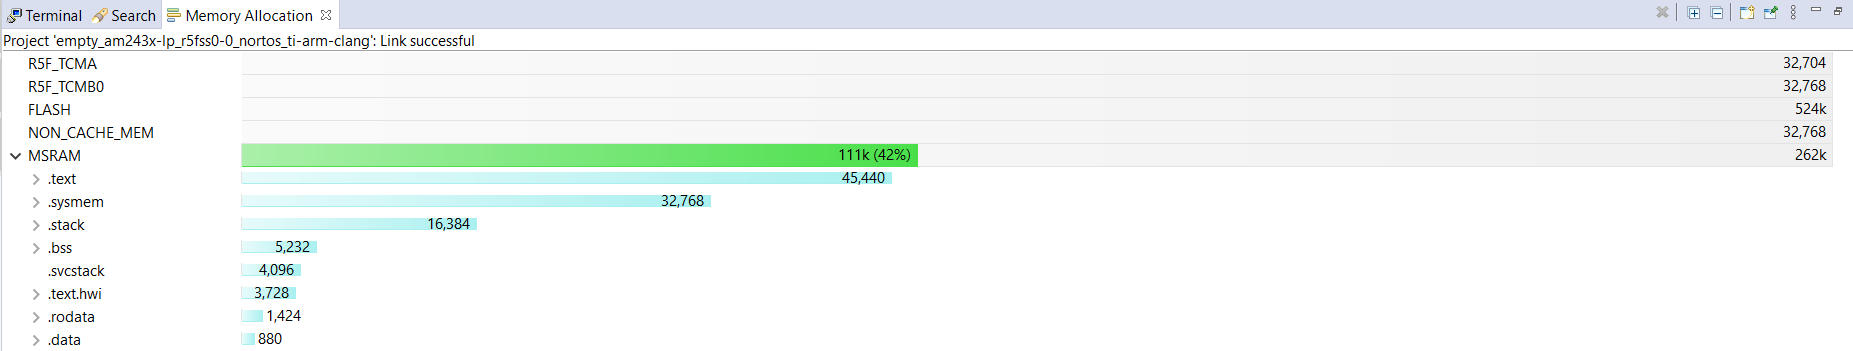
By default, the view shows the memory used relative to the total available memory for the project that is active in the Project Explorer view. You can expand each memory region to see how much memory each individual section or sub-section is using. Another method to debug memory allocation to understand where the memory sections you configured in linker.cmd are actually allocated, is to look at the Debug.map file under Debugà”project_name ”.Debug.map.

For example, in the Am243x linker.cmd file, there is a default section called “vectors”:

SECTIONS
{
.vectors:{} palign(8) > R5F_VECS
...
...
...
}

To understand where exactly this section is allocated and what it contains, check the Debug.map file.

GUID-20220325-SS0I-ZVDN-4RHR-L26C8N50Q3PP-low.png

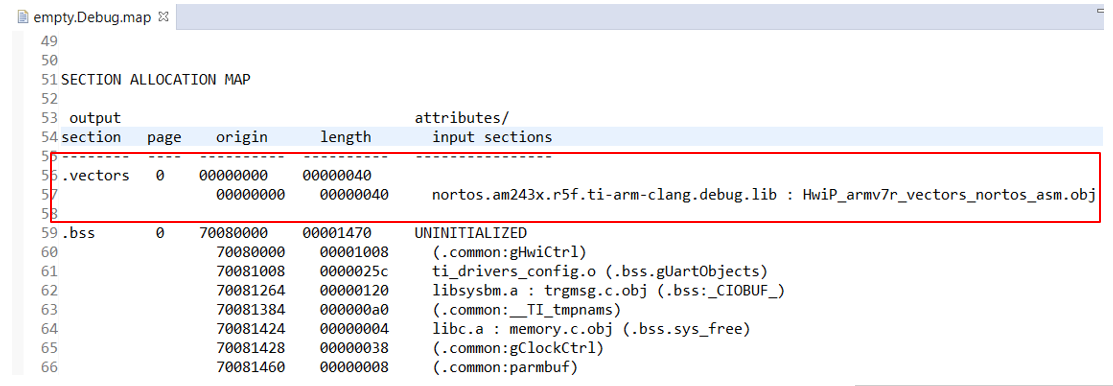
There, this is a specific case, the vectors are located in address 0x00, and contains an object called “HwiP_armv7r_vectors_nortos_asm.obj” from a library named “nortos.am243x.r5f.ti-arm-clang.debug.lib”.