SPRAD28 October   2022 AM2431 , AM2432 , AM2434 , AM2631 , AM2631-Q1 , AM2632 , AM2632-Q1 , AM2634 , AM2634-Q1 , AM26C31 , AM26C31-EP , AM26C31C , AM26C31I , AM26C31M , AM26C32 , AM26C32-EP , AM26C32C , AM26C32M , AM26LS31 , AM26LS31M , AM26LS32A , AM26LS32AC , AM26LS32AM , AM26LS33A , AM26LS33A-SP , AM26LS33AM , AM26LV31 , AM26LV31E , AM26LV31E-EP , AM26LV32 , AM26LV32E , AM26LV32E-EP , AM26S10 , AM2732 , AM2732-Q1


  1.   Abstract
  2.   Trademarks
  3. Building for Debug
    1. 1.1 Disable Code Optimization
    2. 1.2 Using the Debug SDK Libraries
  4. Code Composer Studio Stop-Mode Debugging
    1. 2.1 Configuring the Debugger
    2. 2.2 Breakpoints and Watchpoints
      1. 2.2.1 Software Breakpoints
      2. 2.2.2 Hardware Breakpoints
      3. 2.2.3 Watchpoints
    3. 2.3 Inspecting Device Registers
    4. 2.4 Inspecting Disassembly
  5. Debug Logging
    1. 3.1 Logging Methods
    2. 3.2 Log Zones
    3. 3.3 Asserts
    4. 3.4 Example Usage
  6. Multi-Core Debug
    1. 4.1 Grouping Cores
      1. 4.1.1 Fixed Group
      2. 4.1.2 Hiding Cores
    2. 4.2 Using Multiple Workbench Windows
    3. 4.3 Global Breakpoints
  7. Debugging Arm Cortex-R5 Exceptions
    1. 5.1 Exception Priority Order
    2. 5.2 Aborts
      1. 5.2.1 Data Aborts
        1. 5.2.1.1 Alignment
        2. 5.2.1.2 Background Aborts
        3. 5.2.1.3 Permission
        4. 5.2.1.4 Synchronous/Asynchronous External
        5. 5.2.1.5 Synchronous/Asynchronous ECC
      2. 5.2.2 Synchronous/Asynchronous Aborts
        1. 5.2.2.1 Changing an Asynchronous Abort to a Synchronous Abort
        2. 5.2.2.2 Synchronous Abort
        3. 5.2.2.3 Asynchronous Abort
        4. 5.2.2.4 Debugging Asynchronous Abort
      3. 5.2.3 Prefetch Abort
        1. 5.2.3.1 Possible Reasons for Prefetch Abort
        2. 5.2.3.2 Handling Prefetch Abort Exception
      4. 5.2.4 Undefined Instruction
        1. 5.2.4.1 Possible Reasons for Undefined Instruction Exception
        2. 5.2.4.2 Handling Undefined Instruction Exception
    3. 5.3 Fetching Core Registers Inside an Abort Handler
  8. Debugging Arm Cortex-M4 Exceptions
    1. 6.1 Exception Entry and Exit Sequence
      1. 6.1.1 Entry Sequence
      2. 6.1.2 Exception Exit Sequence
      3. 6.1.3 Decoding EXC_RETURN Value
    2. 6.2 Faults Handling
      1. 6.2.1 There are 15 System Exceptions by Arm Cortex M Processors
        1. 6.2.1.1 Causes of Faults
      2. 6.2.2 HardFault Exception
        1. 6.2.2.1 Causes of HardFault Exception
      3. 6.2.3 Configurable Fault Exceptions
        1. 6.2.3.1 Mem Manage Fault Exception
        2. 6.2.3.2 BusFault Exception
        3. 6.2.3.3 Usage Fault Exception
      4. 6.2.4 Control Registers
        1. 6.2.4.1 SHP - System Handler Priority Register
      5. 6.2.5 Status Registers
        1. 6.2.5.1 Undefined Instruction Handling Example
        2. 6.2.5.2 Invalid State Handling Example
      6. 6.2.6 Printing the Stack Frame
  9. Debugging Memory
    1. 7.1 Viewing Device Memory
    2. 7.2 Linker Command File (linker.cmd)
      1. 7.2.1 The Memory Directive
      2. 7.2.2 The Sections Directive
    3. 7.3 Stack Overflow
      1. 7.3.1 -fstack-protector
      2. 7.3.2 -fstack-protector-strong
      3. 7.3.3 -fstack-protector-all
      4. 7.3.4 Enabling Stack Smashing Detection
      5. 7.3.5 Enabling Stack Smashing Detection
    4. 7.4 Variables and Expressions View in CCS
    5. 7.5 Understanding Your Application's Memory Allocation
    6. 7.6 FreeRTOS ROV
  10. Debugging Boot
    1. 8.1 ROM Boot
    2. 8.2 SBL Boot
    3. 8.3 GEL Files
      1. 8.3.1 Debugging Init Code
        1. 8.3.1.1 Disable Auto-Run to Main
  11. Debugging Real-Time Control Loops
    1. 9.1 Trace
      1. 9.1.1 Processor / Core Trace
      2. 9.1.2 How to Use CCS to Capture Trace Data on an AM243x
    2. 9.2 Code Profile / Coverage
      1. 9.2.1 CCS Count Event
    3. 9.3 Real-Time UART Monitor
      1. 9.3.1 Confirm CCS Features
      2. 9.3.2 Create Target Configuration File
      3. 9.3.3 Add Serial Command Monitor Software
      4. 9.3.4 Launch Real Time Debug
  12. 10E2E Support Forums

Inspecting Disassembly

This section covers how to use the CCS Disassembly view to get further insight into your running software.

The CPU opcodes of the software executing on the target can be viewed in the Disassembly window (View → Disassembly) of the core. Assembly step into and step over buttons in the debug window can be used to step through the disassembly.

GUID-20220325-SS0I-2JR9-JGS3-V3KWLBRMNRVZ-low.png

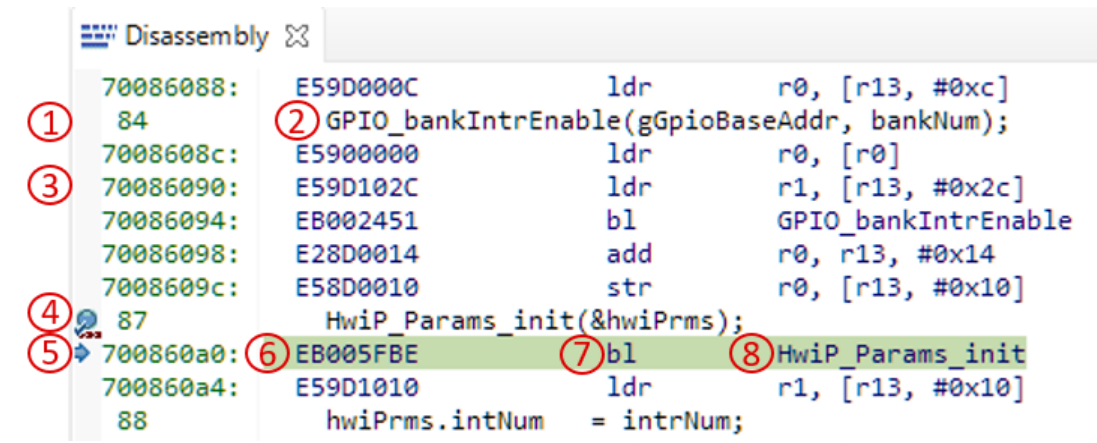
The Disassembly view contains several points of information:

  • Line numbers of the source file in context
  • C source code at the line number
  • Program addresses
  • Breakpoint indicators
  • Program Counter - the next instruction to be executed
  • Opcodes in hex format
  • Disassembled instructions
  • If the opcode references a function or variable, their names are also shown