TIDA029A july 2019 – june 2023 CC2640R2F-Q1 , CC2642R , CC2642R-Q1
- 1
- Bluetooth Angle of Arrival (AoA) Antenna Design
- Trademarks
- 1Introduction
- 2Angle of Arrival Antenna Design Considerations
- 3Dipole Antenna Array
- 4Calculating AoA From IQ Measurements
- 5References
- 6Revision History
3.4.2 Measuring Antenna 1 and 2 Phase Difference
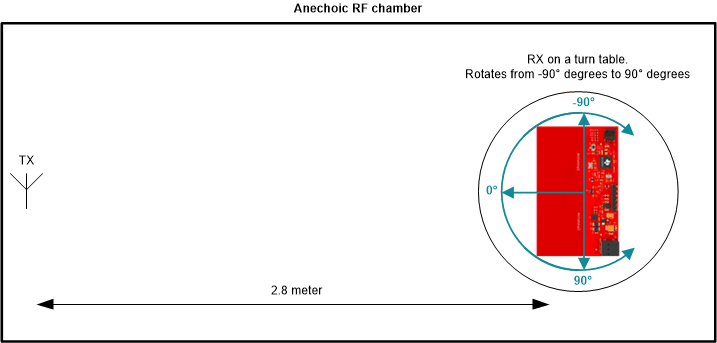
To measure the phase difference between antenna 1 and antenna 2 across –90° to 90°, the turntable (Figure 3-13) was turned from –90° to 90° in 1° increments. I/Q data was collected at each angle, referenced as Phi, from 4 AoA packets at every Bluetooth Low Energy channel. This includes all 40 channels from 2402 MHz to 2480 MHz for a total of 160 AoA packets per angle. Figure 3-34 shows the setup.
 Figure 3-34 Phase Difference Measurement Test Setup
The TIDA-01632 reference design is set up to collect IQ data in 4-µs time-slots from each antenna. The sampling rate is set to 4 MSPS which provides 16 IQ samples per time-slot.
There are various methods and approaches that can be used for AoA estimation. In this application report, the phase difference between two antennas is used to calculate the AoA. Because the AoA tone that is captured has a period equal to the time-slot period (250- KHz tone = 4-µs period), the phases of the same sample number between time-slots can be compared and the phase difference calculated. To calculate the phase difference between two IQ samples (one IQ sample per antenna), the sample from the first antenna is multiplied with the complex conjugate of the sample from the second antenna.


In the equations α represents the phase and r represents the magnitude in Equation 1 to Equation 3. Note that the first 8 samples in each time slot are discarded due to antenna switching and settling time so only sample 8 to 15 in each slot are used. See the BLE-Stack User's Guide: RTLS Toolbox - AoA for more information on the calculation.
Section 3.4.2.1 through Section 3.4.2.4 show the test results from 4 different hardware setups using the TIDA-01632 PCB. The y-axis on the graphs show the average phase difference between antennas 1 and 2 while the x-axis shows the angle the PCB is facing from the transmitting antenna. The more yellow the trace the lower the frequency, the more red the trace the higher the frequency, and middle frequencies appear as orange traces. When looking at the results from each test setup, the better results have the most linear data.