TIDA029A july 2019 – june 2023 CC2640R2F-Q1 , CC2642R , CC2642R-Q1
- 1
- Bluetooth Angle of Arrival (AoA) Antenna Design
- Trademarks
- 1Introduction
- 2Angle of Arrival Antenna Design Considerations
- 3Dipole Antenna Array
- 4Calculating AoA From IQ Measurements
- 5References
- 6Revision History
2.1 Antenna Spacing
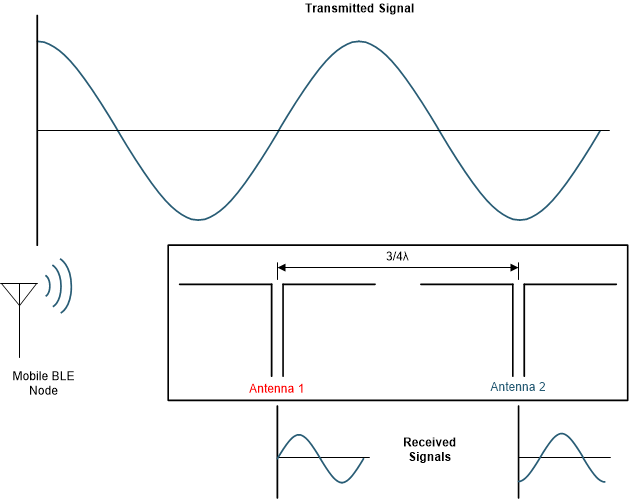
The two receiving antenna phase centers must be within ½ λ (maximum phase difference of 180°) to easily determine which antenna is closer to the transmitter. In a two-antenna system, each antenna takes turns measuring phase. Once phase measurements are completed, the phase difference between the antennas is used to calculate the AoA. If the difference is greater than 180°, the true phase difference could be incorrectly interpreted. Figure 2-1 shows an example of a Bluetooth Low Energy transmitting node 180° from an antenna array with ¾ λ distance between antenna phase centers.
 Figure 2-1 Antenna Array With ¾ λ
Spacing
Figure 2-1 Antenna Array With ¾ λ
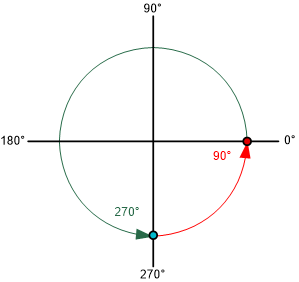
SpacingAntenna 1 measures 0° and antenna 2 measures 270° (–90°), the phase difference should be calculated as 270°. However, the phase difference could be interpreted incorrectly as a 90° difference from 270° to 0° as the phase diagram in Figure 2-2 shows.
 Figure 2-2 Example Phasor Diagram of ¾ λ
Antenna Spacing
Figure 2-2 Example Phasor Diagram of ¾ λ
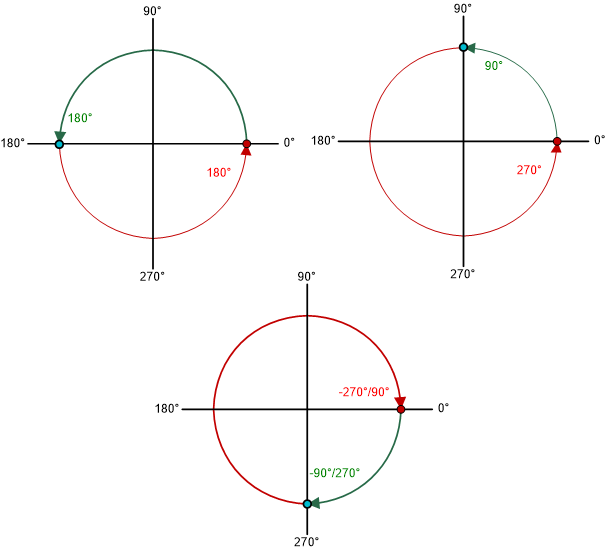
Antenna SpacingBy ensuring the antennas are at max ½ λ, the phase difference range always falls from 0° to 180° (or –180°) and there is no issue determining which antenna is closer to the transmitting node because the lowest phase difference is always correct whether positive or negative as Figure 2-3 shows.
 Figure 2-3 Phasor Diagram with ≤ ½ λ
Antenna Spacing
Figure 2-3 Phasor Diagram with ≤ ½ λ
Antenna SpacingIf the antenna array is designed at the center of the Bluetooth spectrum (2.44 GHz), the antenna spacing must be less than or equal to 61.5 mm. Therefore, antenna coupling can become an issue affecting the antenna arrays efficiency.